Quantcast
Channel: Telerik Blogs | Testing
Viewing all 339 articles
Browse latest View live

Automated Testing for Mobile Apps

$
0
0

Mobile quality is the largest challenge mobile developers will encounter, with devs dealing with app complexity, device fragmentation, fast release cycle, short user sessions and higher user expectations for mobile applications. In this article, Sean Sparkman walks you through some of the basics of automated UI testing.

Gone are the days of single-screen mobile applications—applications are becoming more and more complex with each passing year. These complex features need to be tested. Existing features need to be retested even when making a minor change to another part of the application. This can take valuable time away from development and draw out release times.

In consumer mobile applications, users want to be able to open a mobile app and quickly complete a task. If users cannot start their task within three seconds of pressing the app icon, they will find another application. If an app developer finds a good idea, it will not be long before someone else copies it.

Everyone knows about version fragmentation on Android. Certain manufacturers do not let you upgrade to newer version of Android. Oreo only has a 12.1% adoption rate as of July 23, 2018, according to Google. This is one year and four months after being released.

Version

Codename

API

Distribution

2.3.3-2.3.7

Gingerbread

10

0.2%

4.0.3-4.0.4

Ice Cream Sandwich

15

0.3%

4.1.x

Jelly Bean

16

1.2%

4.2.x


17

1.9%

4.3


18

0.5%

4.4

KitKat

19

9.1%

5.0

Lollipop

21

4.2%

5.1


22

16.2%

6.0

Marshmallow

23

23.5%

7.0

Nougat

24

21.2%

7.1


25

9.6%

8.0

Oreo

26

10.1%

8.1


27

2.0%

Device fragmentation further complicates this issue. There are six different screen densities on Android. In this ever-growing device market, you need to be able to test your application on more than a personal device.

Web applications have more leeway when it comes to users. Users expect more from their mobile applications. Slow load times and performance for web applications is often chalked up to slow network speeds. Since mobile applications are installed on the device, users expect the application to perform faster. Even without a network connection, the app must still work—even if just displaying an error message. This is actually tested during Apple App Store Review. No network connection is commonly tested, but slow connections are not. The user interface must still be responsive while pulling data from an API even with sluggish connection.

Testing applications under slow and no connection conditions is a good first step. The next step is error path testing. Handling error conditions can make or break an application. Crashing is a major no-no. Unhandled errors in a web browser will typically not crash the browser window. Native applications crash on error, full stop. If the API is up but the database is down, it may cause unexpected errors. Many users will stop using or even uninstall an application if it crashes. If the user is frustrated enough, they will write a review with low or no stars. Low-star reviews are very difficult to come back from. The most common error I have seen is when a developer accesses a UI element from a background thread. On an iOS simulator, nothing will happen. The UI element will not update, and no errors will be thrown. However, when executing on a physical device, it will cause a crash. If the developer only tests on simulators, they will never discover their critical error.

The Various Ways of Testing Applications

There are several different ways to test an application. Beta testing with users is great in that it tests with real users, but it is difficult getting good feedback. Manual testing is very slow, limits the number of devices you can use and is not a realistic test. Unit testing should always be done, but it should be done in addition to integrated testing and is far from realistic.

So how do we test quickly, on a broad set of devices, and with every release?  Automated UI testing is the answer. My preferred toolset for automating UI testing is Xamarin.UITest. It can be quickly and easily written with C#. Tests can tap, scroll, swipe, pinch, enter text and more inside a native application, regardless of whether it’s Xamarin or not. These tests can then be run locally on simulators and devices. Once the application is ready to be tested against a broader set of physical devices, these same tests can be run inside of Microsoft’s App Center against most popular devices on a number of a different versions of iOS and Android.

The best way to get started writing UI tests is with Xamarin.UITest’s built in REPL. If you’re not familiar with REPL, it’s an acronym that stands for Read-Evaluate-Print-Loop.  REPL is a great way to start learning a new language or new framework. It allows you to quickly write code and see the results. Xamarin.UITest’s REPL can be opened by calling app.Repl().

[Test]
public void ReplTest()
{
    app.Repl();
}

Running a test with the REPL method call will open a console. The console is equipped with auto-complete. Developers can work through the steps inside the console to test their application. Once done with a test, the copy command will take all the steps used into the REPL and place them into the clipboard. Finally, the developer can take the copied commands and paste them into a new test method in their UITest project.

1 AT4MA 

The application’s UI elements can be examined by calling the tree command inside of the console. This will display a list of elements with their children. Elements can be interacted with from the console using commands like Tap and EnterText. When writing a test, WaitForElement should be called. This will cause the test to wait for the specified element to become available. When automated, it is necessary to wait for the screen to load, but it won’t be when using the console.

Elements are referenced by using the Marked or Query methods. These methods rely on the id field for iOS, label for Android, and finally the AutomationId for Xamarin.Forms.  When using Xamarin.Forms, the same UITests can be used for Android and iOS if there aren’t too many platform specific tweaks.

Once a test is setup and any necessary steps performed, the Query method can be executed to gain access to elements on the screen. At this point, values and displayed text are tested to see the results of the test. This would be performed like any other unit test.  Xamarin.UITest is running on top of NUnit 2.6 and asserts are available inside of test methods.

[Test]
public void ReplTest()
{
    app.WaitForElement("FirstName");

    app.EnterText(a => a.Marked("FirstName"), "Sean");
    app.EnterText(a => a.Marked("LastName"), "Sparkman");
    app.DismissKeyboard();
    app.Tap(a => a.Marked("OnOff"));
    app.Tap(a => a.Marked("Submit"));

    app.WaitForElement("Result");
    var label = app.Query(a => a.Marked("Result"));

    Assert.AreEqual(1, label.Length);
    Assert.AreEqual("Success", label[0].Text);
}

A great example of a test to automate is registration. This workflow should be tested with every version, but a manual test should not be necessary. A developer could create multiple successful and failing tests of registration. Failing tests could include when not connected to the internet, using invalid data in fields or trying to register as an existing user. These are important to test with each release but take up valuable time that could be spent on testing new features.

Once written, UITests can be run locally with either a simulator, emulator or physical device that is plugged into the executing computer. However, this does limit the number of devices that these tests can be run against. The next step is to upload to Microsoft’s Visual Studio App Center, which increases the number of devices tested on. Once uploaded, the devices used for the tests can be selected. Microsoft allows for testing on thousands of iOS and Android devices in the cloud. Each step along the way can be documented visually with the Screenshot method. Screenshot allows for a string to be provided with a meaningful name for the screenshot. This method can be works locally as well to provide a view into what is happening with the tests.

2 AT4MA

Even if Xamarin.UITest is not used, best practices should include using an automated UI testing framework. Regression testing and testing on multiple devices should always be done when working in mobile development. The mobile app stores are a highly competitive space.  Developers need to be able to move quickly and respond by releasing new versions with new features to be competitive. Automated testing allows programmers to push forward with confidence and speed without compromising on quality, because quality is king.


More Better Quality Coverage by Jim Holmes at DevReach 2018

$
0
0

In 2018 we witnessed the 10th anniversary of the best developer conference in Central and Eastern Europe - DevReach, proudly hosted by Progress. It was packed with 3 workshops, 3 inspiring keynotes, 42+ technical sessions and one awesome party with live music.

Anniversary

Among these sessions we saw Jim Holmes sneaking in with his intriguing presentation on how driving better conversations inside your testing team will give better quality coverage and overall - Better Stuff.

In this session Jim walks through creating a critical business feature, taking you all the way from ideation through production monitoring. He describes where to have various conversations about quality, and what you might consider along the way.
Watch the "More Better Quality Coverage" presentation below.

If you want to try some of Jim's advice while crafting top-notch test automation, you need to check Test Studio out. You can activate a fully functional 30-day trial here:

Try Test Studio

Posting your Test Studio Results in Slack

$
0
0

Monitoring your CI/CD daily can sometimes be a very cumbersome job. Learn how you can make your life easier by posting your Test Studio results directly in Slack.

When it comes to testing, if your organization is using many different tools in its build chain, you probably need to monitor several different UIs. That could be simplified though, if most of your monitoring could be done in one place. If, by chance, your team uses Slack for collaboration, you can use it for more than just messaging. Slack has great extensibility through its APIs.
Telerik Test Studio allows for easy integrations with other tools and solutions, thanks to its execution extensions. In this blog post I will show you how easily you can build an extension that will post your test list run results in Slack.


Building an Test Studio Extension for Slack

Creating Web Hook

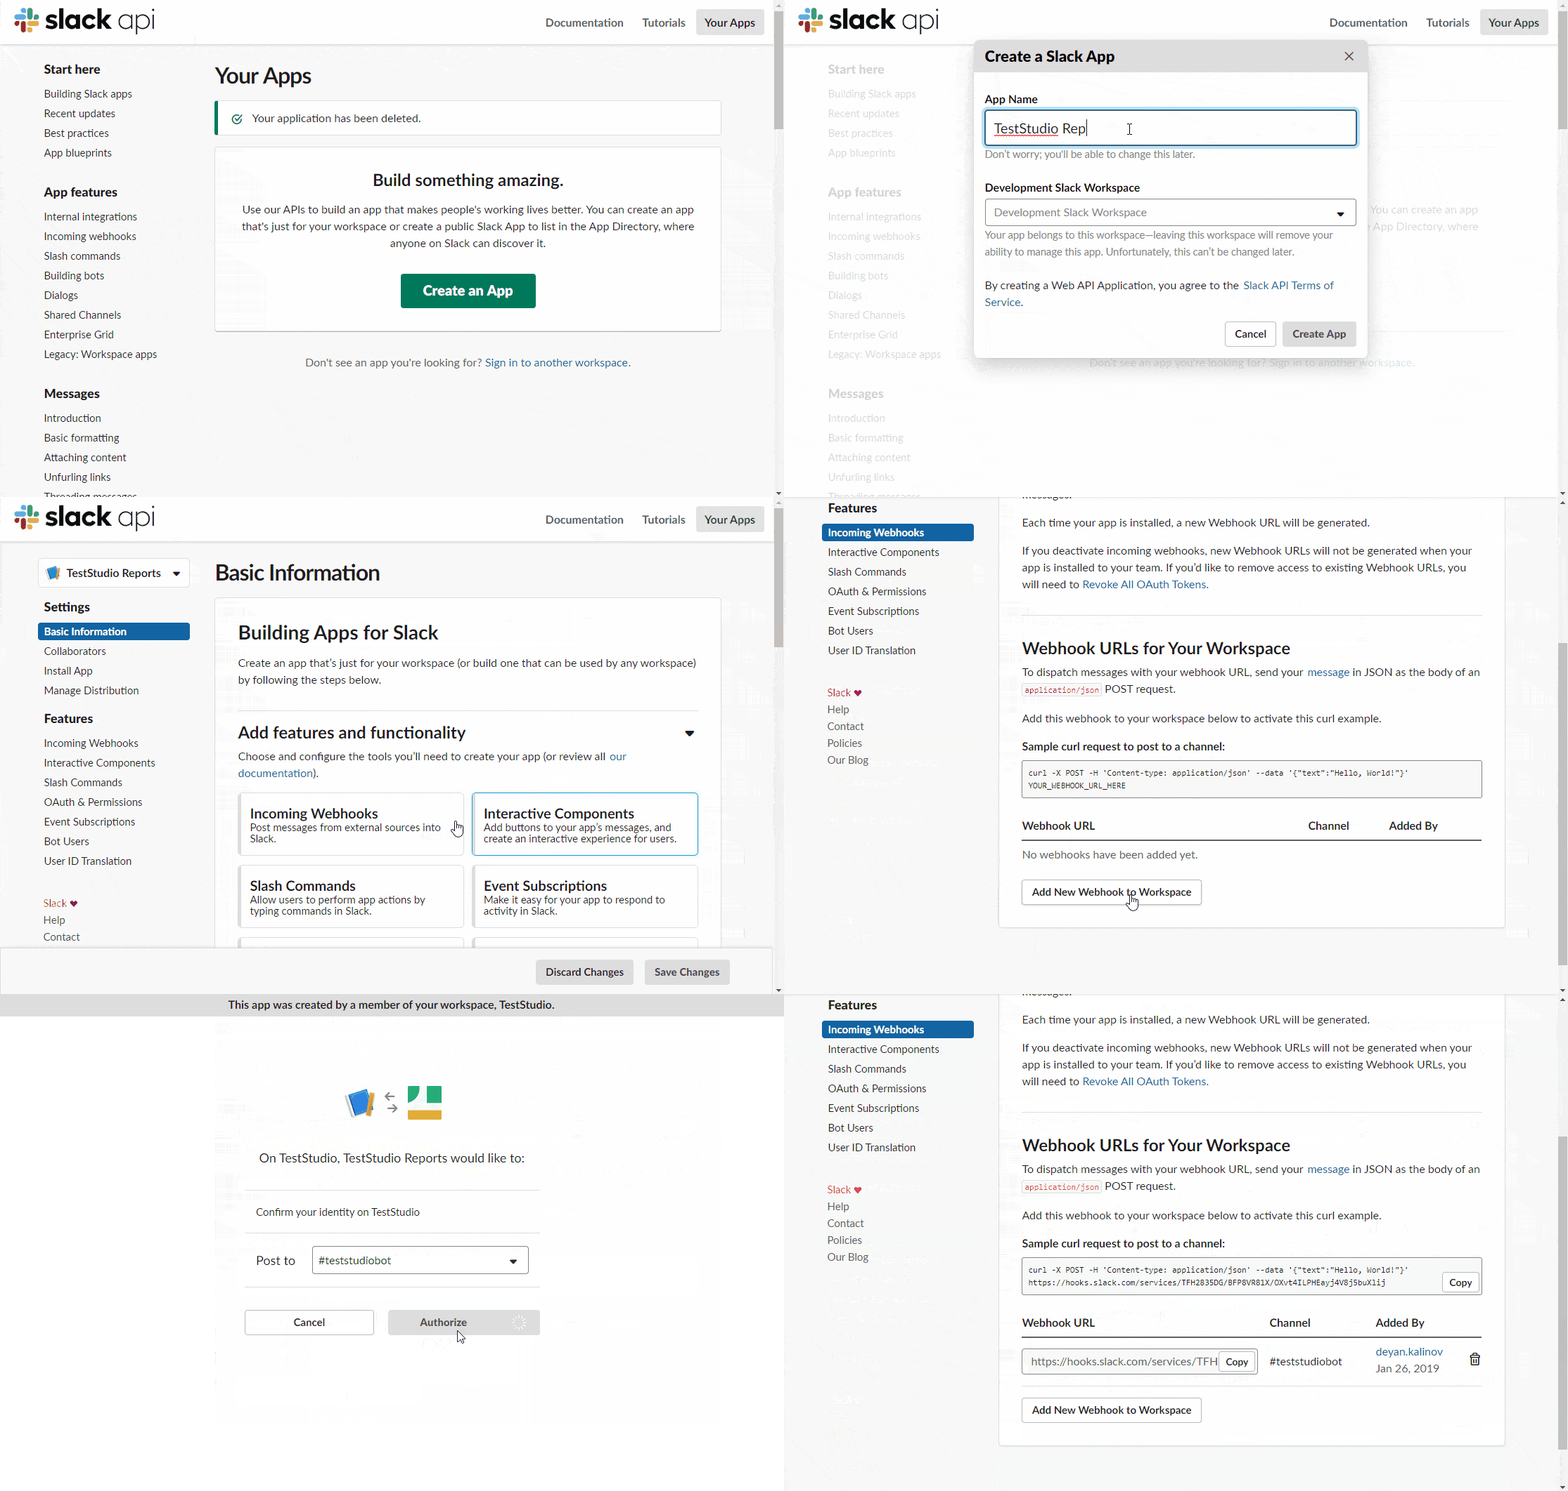
Let’s start with the creation of a new Slack app and a web hook that posts to a channel:

SlackWebHook

  1. First we need to create new Slack app, to do that go to: https://api.slack.com/apps
  2. Then activate the app's incoming web hooks
  3. Last, create new web hook URL, which will give us a link where we can post our messages - the web hook URL should look something like this: https://hooks.slack.com/services/XXXXXXXXX/XXXXXXXX/XXXXXXxxxxxxXXXXXXX

Add a New Entry in Windows Registry

One good security practice is to keep secrets out of the source code and to do that we will proceed with creating a new registry entry that will hold our web hook URL.

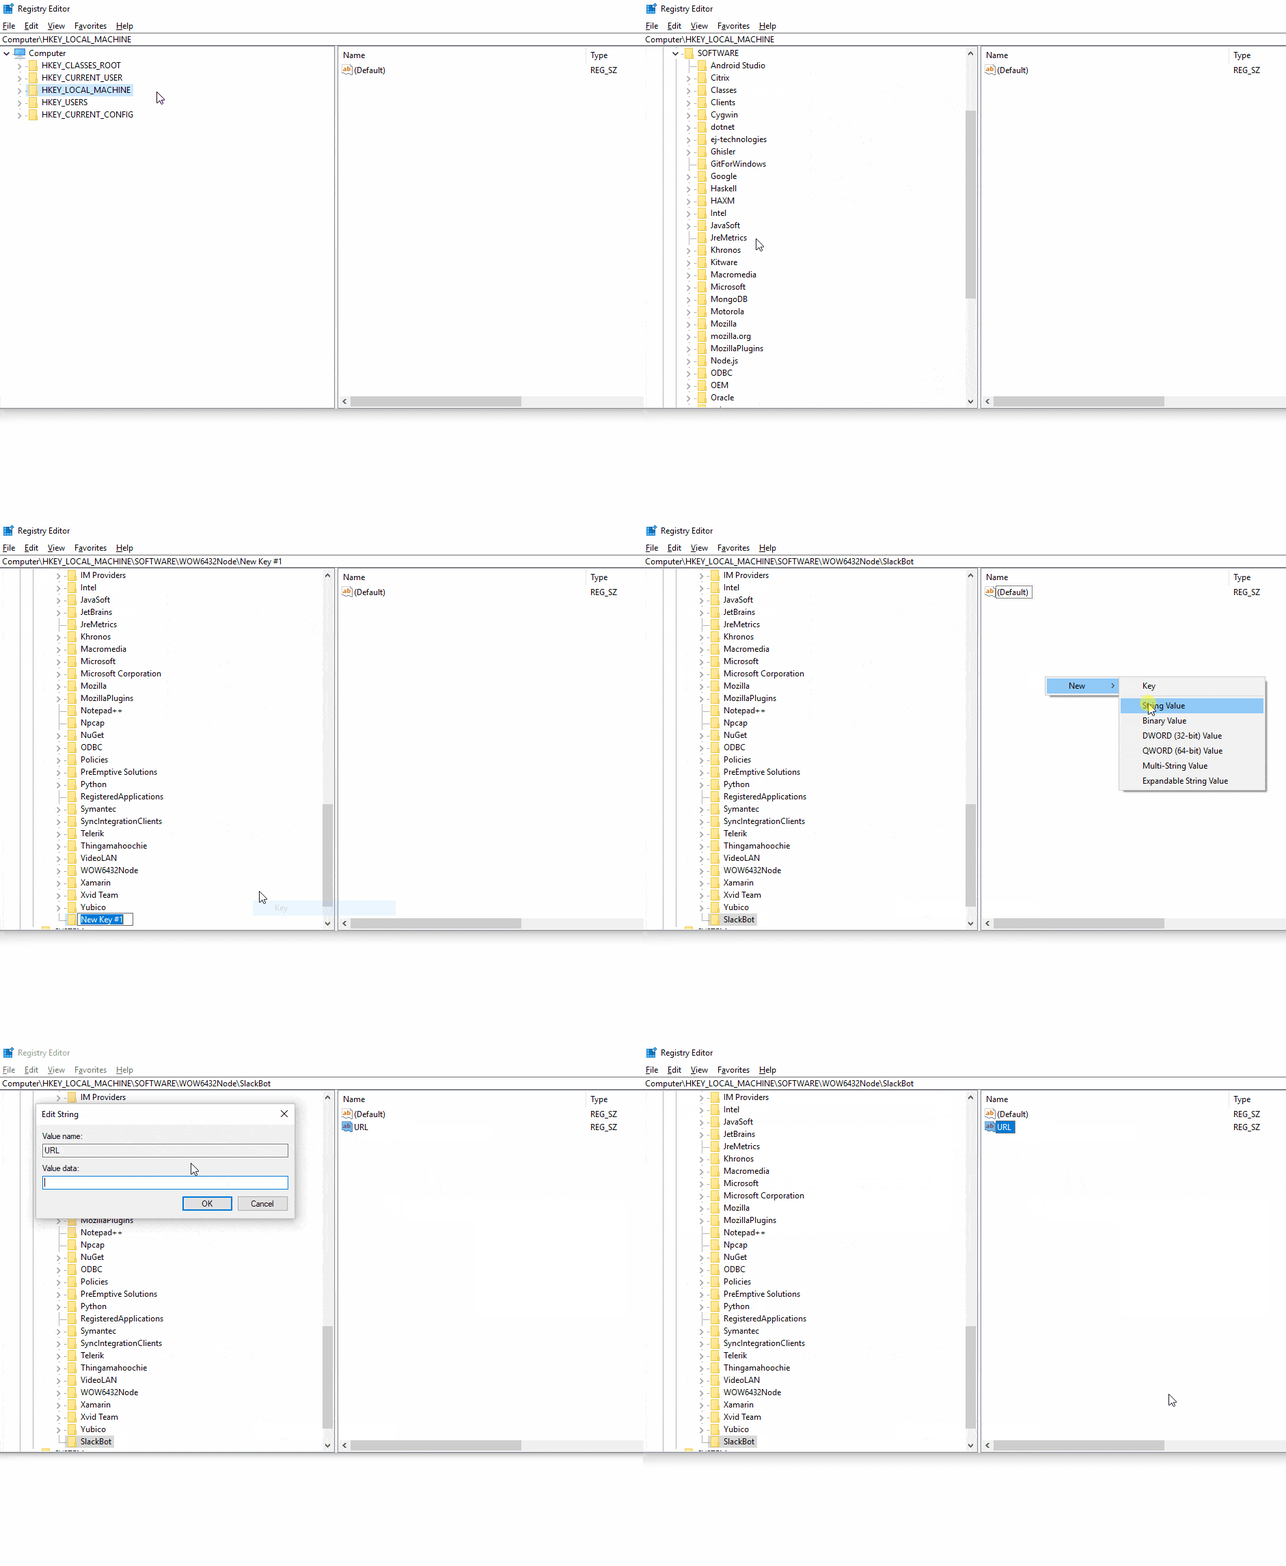
Adding web hook to registry

  1. Start Windows registry editor
  2. Navigate to HKEY_LOCAL_MACHINE\SOFTWARE\WOW6432Node (if you are using 32-bit Windows use HKEY_LOCAL_MACHINE\SOFTWARE instead)
  3. Add new key and name it "SlackBot"
  4. In the "SlackBot" key add a new string value with the name "URL," and paste the web hook URL as its value

Creating a Test Studio Extension

Now let's get your hands dirty and start building our Test Studio extension.

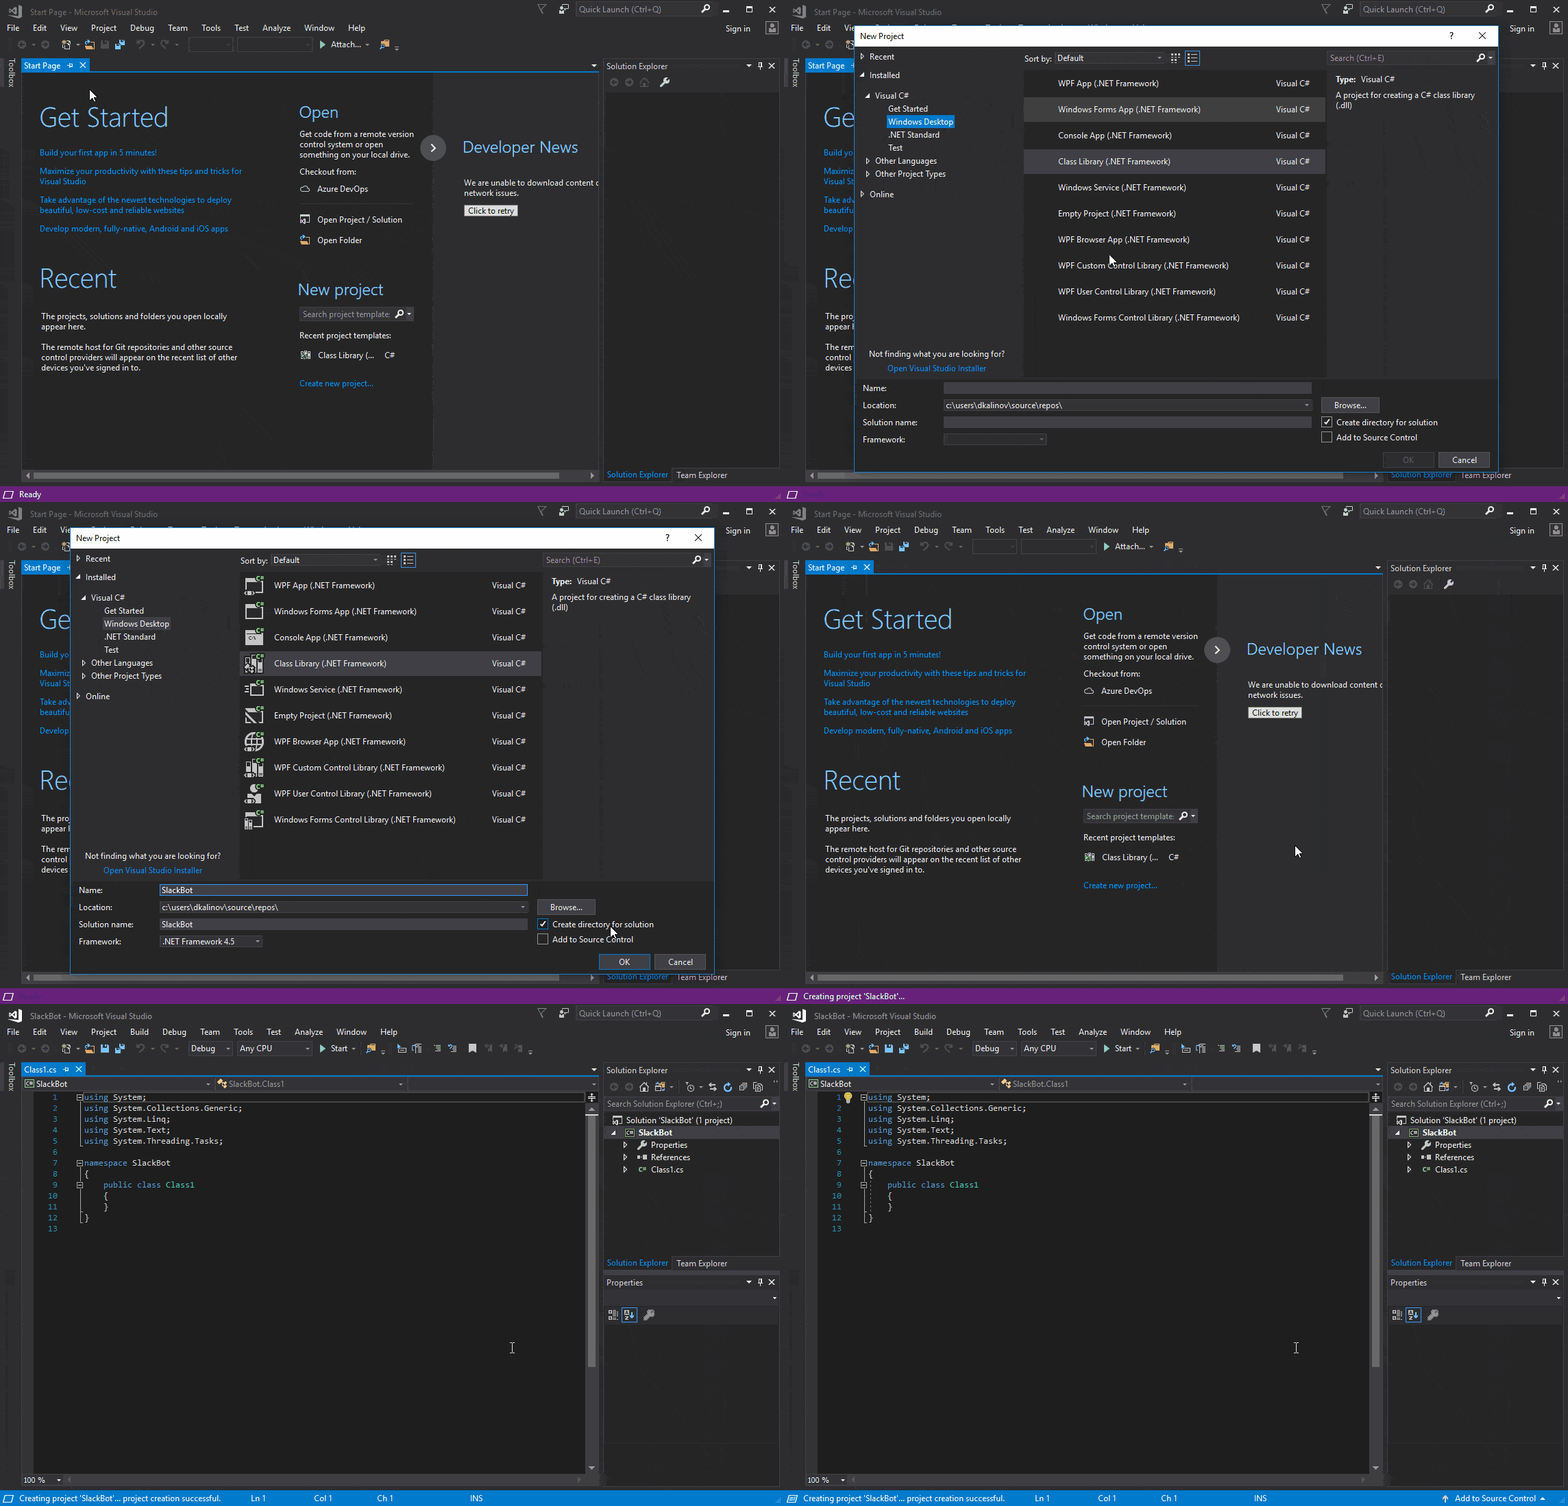
  1. We will start by creating new project in Visual Studio 2017
  2. For project type select Visual C# -> Windows Desktop -> Class Library (.NET Framework)
  3. Make sure that the selected framework is ".NET Framework 4.5"
  4. Give your project a name and click "OK"

Create new project

Our next step should be adding dependencies to the project. There are two dependencies that we need to refer to.

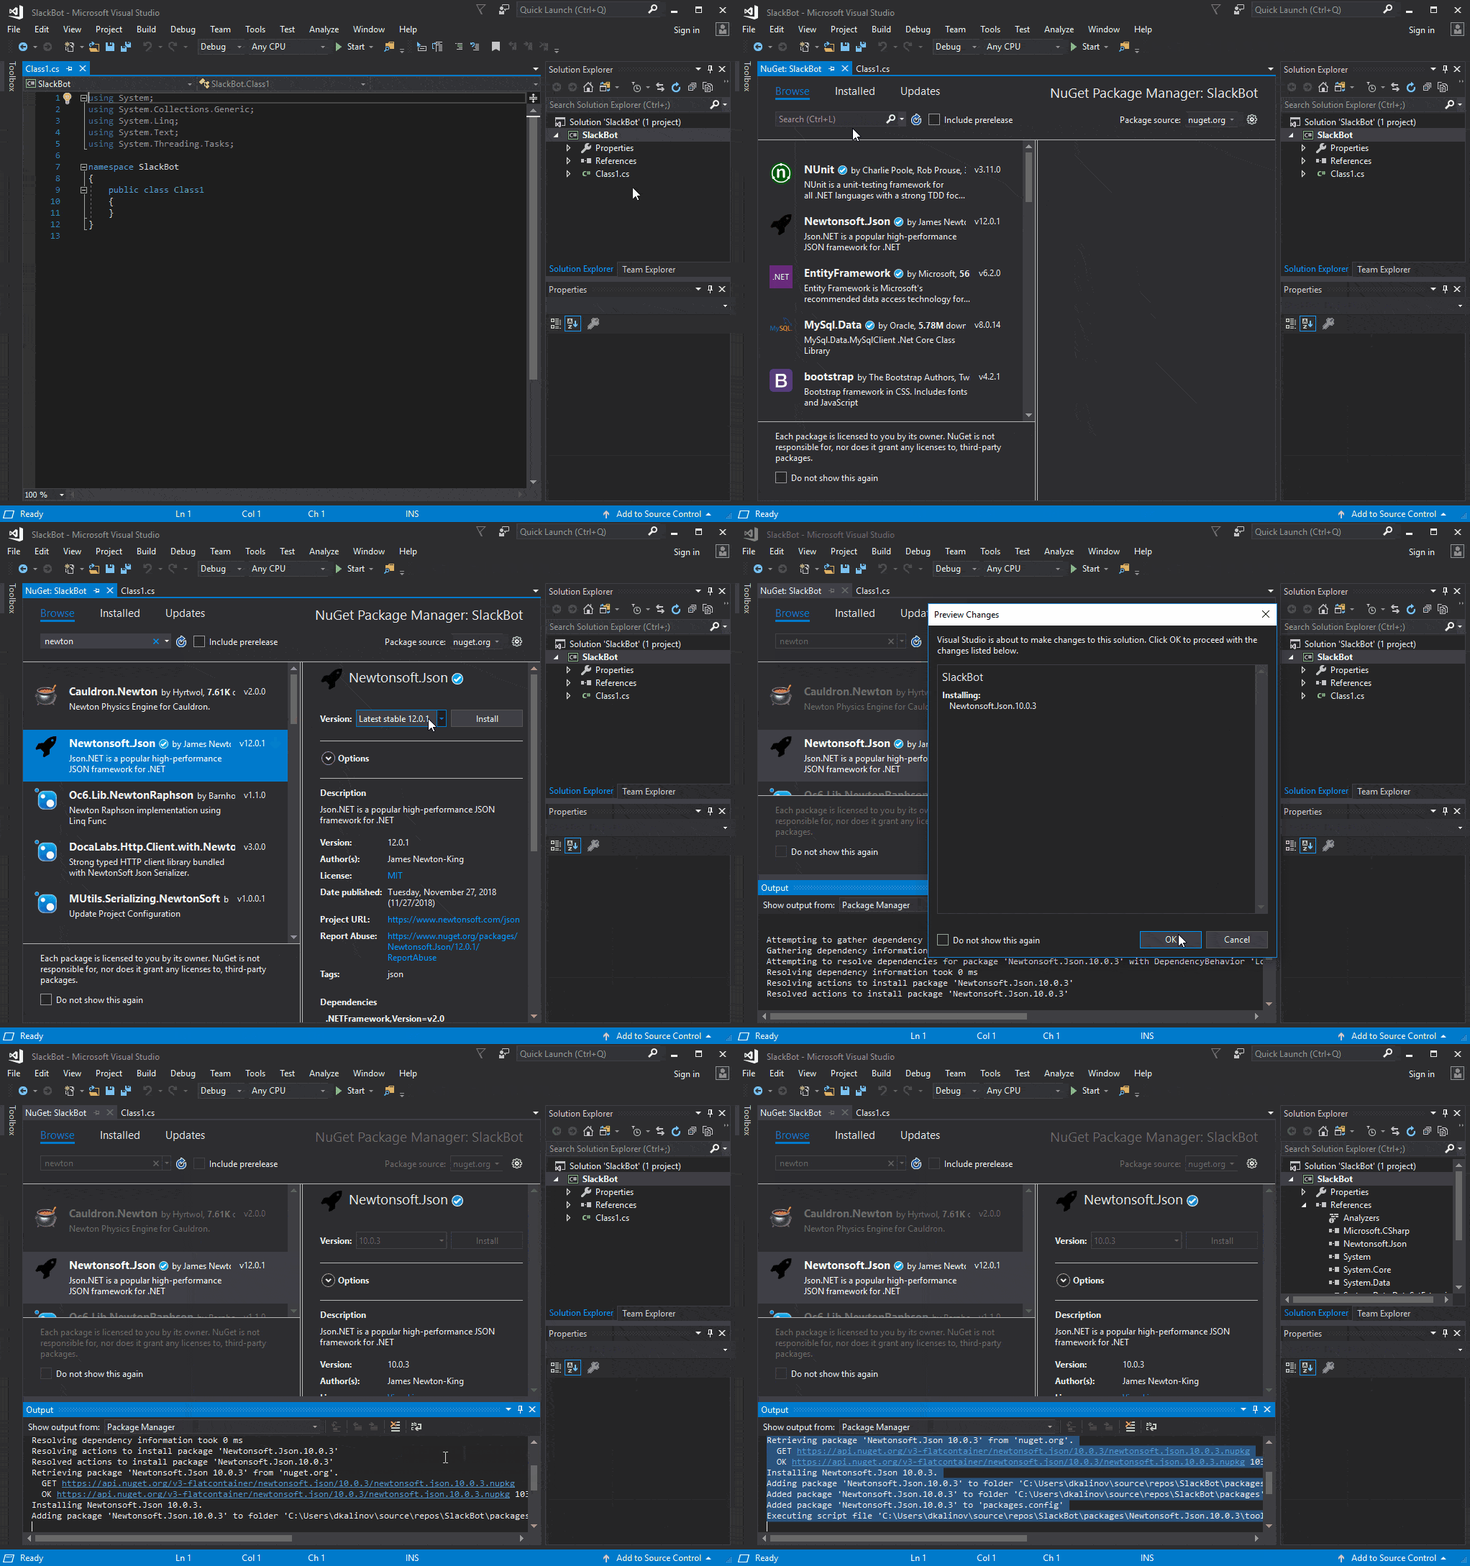
The First one is Newtonsoft.Json. You can add it as nuget library from the Visual Studio NuGet manager, just make sure to install version 10.0.3.

Add Newtonsoft.JSON

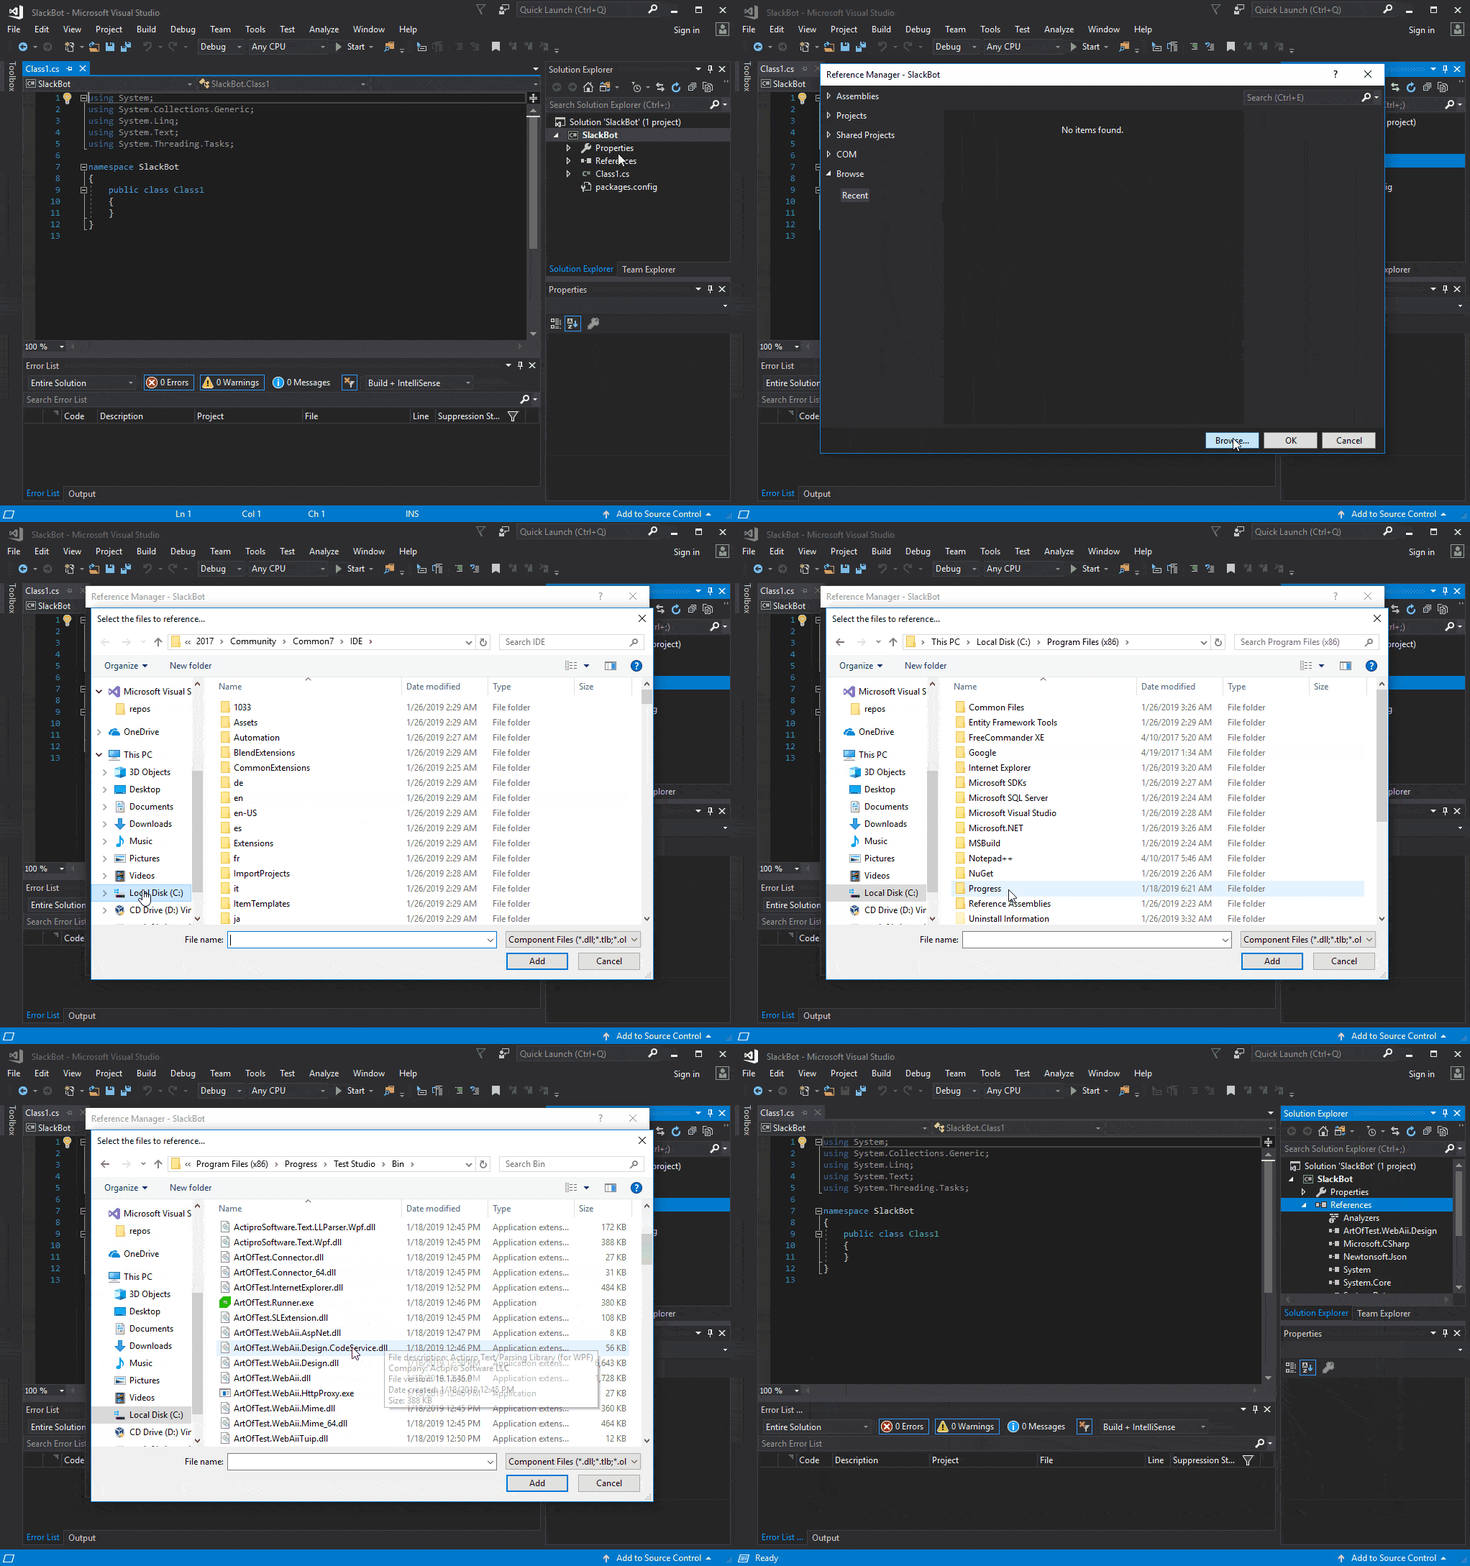
The second dependency is ArtOfTest.WebAii.Design.DLL. To add it, just right click on project references and select "Add reference...". Select "Browse" and navigate to your Test Studio bin folder (by default it is located in %ProgramFiles%\Progress\Test Studio\Bin)

Add ArtOfTest.WebAii.Design

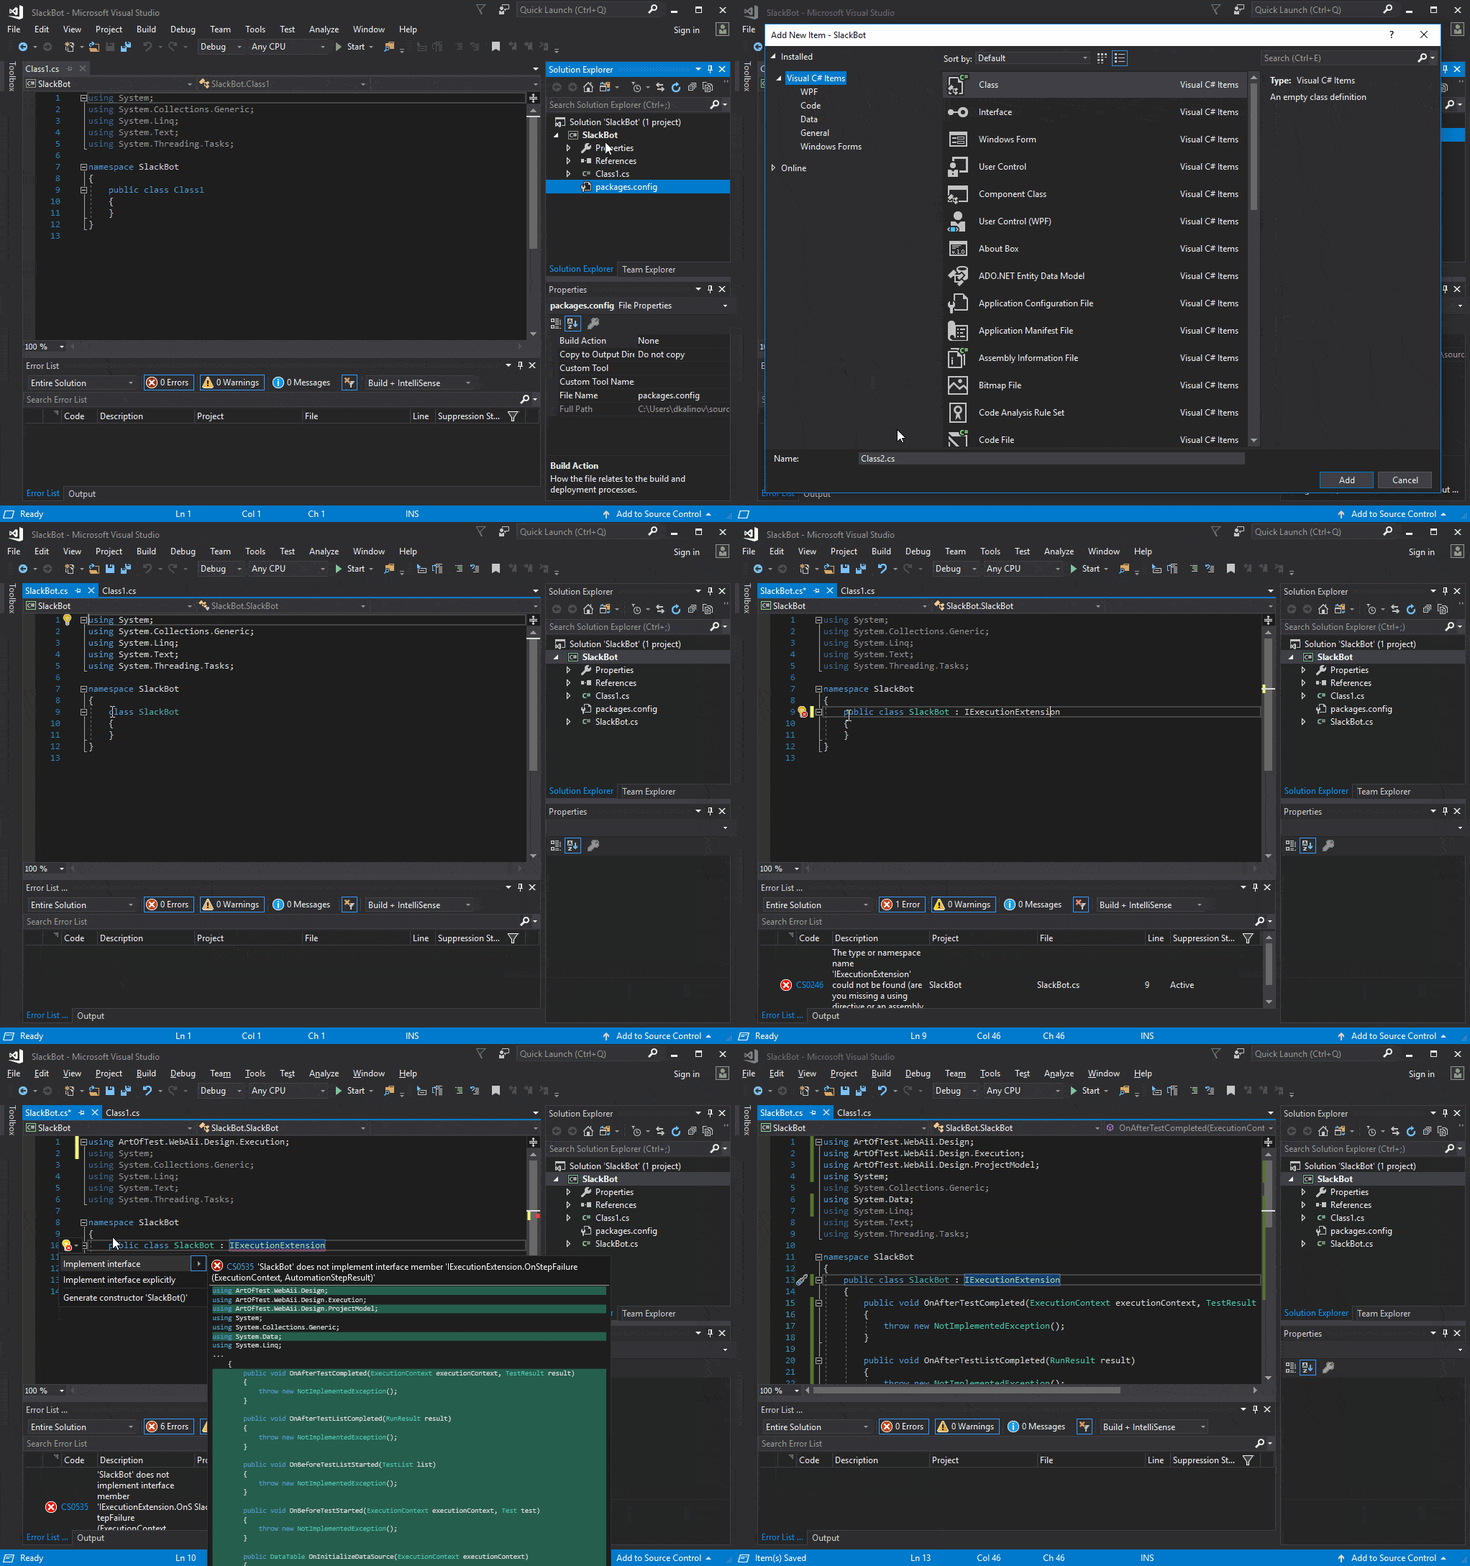
After adding the necessary dependencies, we are ready to start coding our extension. Let's begin with the implementation of the Test Studio run time extension interface. To do that, add a new class file to the project and name it SlackBot.cs. This class should implement the IExecutionExtension interface.

Interface implementation

The resulting file should look like this:

using ArtOfTest.WebAii.Design;
using ArtOfTest.WebAii.Design.Execution;
using ArtOfTest.WebAii.Design.ProjectModel;
using Microsoft.Win32;
using SlackBot.Data;
using System;
using System.Data;
 
namespace SlackBot
{
    public class SlackExtension : IExecutionExtension
    {
        private string urlWithAccessToken = " ";  
        // Web hook registry key
        private const string SLACK_BOT_REG_KEY = @"Software\SlackBot";
 
        public void OnBeforeTestListStarted(TestList list)
        {
            // Get Web Hook URL from Windows Registry
            using (var key = Registry.LocalMachine.OpenSubKey(SLACK_BOT_REG_KEY))
            {
                if (key != null)
                {
                    var url = key.GetValue("URL");
                    if (url != null)
                    {
                        this.urlWithAccessToken = url as string;
                    }
                }
            }
        }
 
        public void OnAfterTestListCompleted(RunResult result)
        {
            if (!string.IsNullOrEmpty(this.urlWithAccessToken))
            {
                var client = new SlackClient(this.urlWithAccessToken);
                var msg = MessageCreator.GetMessage(result);
                client.PostMessage(msg);
            }
        }
 
        public void OnAfterTestCompleted(ExecutionContext executionContext, TestResult result)
        {
        }
 
        public void OnBeforeTestStarted(ExecutionContext executionContext, Test test)
        {
        }
 
        public DataTable OnInitializeDataSource(ExecutionContext executionContext)
        {
            return null;
        }
 
        public void OnStepFailure(ExecutionContext executionContext, AutomationStepResult stepResult)
        {
        }
    }
}

Method OnBeforeTestListStarted is called every time before the start of test list execution, and that's the right place for us to read our registry key, which we created earlier in this post.

In OnAfterTestListCompleted, we receive the test list execution result when the run completes. Here we are creating and sending the Slack message.

Now we need to create data classes, needed for serialization/de-serialization. Create a folder in the project and give it a name "Data." In it add one new file named "Message.cs":

using Newtonsoft.Json;
using System;

namespace SlackBot.Data
{
    public class Message
    {
        [JsonProperty("channel")]
        public string Channel { get; set; }

        [JsonProperty("username")]
        public string Username { get; set; }

        [JsonProperty("text")]
        public string Text { get; set; }

        [JsonProperty("attachments")]
        public Attachment[] Attachments { get; set; }
    }

    public class Attachment
    {
        [JsonProperty("fallback")]
        public string Fallback { get; set; }

        [JsonProperty("color")]
        public string Color { get; set; }

        [JsonProperty("pretext")]
        public string Pretext { get; set; }

        [JsonProperty("author_name")]
        public string AuthorName { get; set; }

        [JsonProperty("author_link")]
        public Uri AuthorLink { get; set; }

        [JsonProperty("author_icon")]
        public Uri AuthorIcon { get; set; }

        [JsonProperty("title")]
        public string Title { get; set; }

        [JsonProperty("title_link")]
        public Uri TitleLink { get; set; }

        [JsonProperty("text")]
        public string Text { get; set; }

        [JsonProperty("fields")]
        public Field[] Fields { get; set; }

        [JsonProperty("image_url")]
        public Uri ImageUrl { get; set; }

        [JsonProperty("thumb_url")]
        public Uri ThumbUrl { get; set; }

        [JsonProperty("footer")]
        public string Footer { get; set; }

        [JsonProperty("footer_icon")]
        public Uri FooterIcon { get; set; }

        [JsonProperty("ts")]
        public long Ts { get; set; }

        [JsonProperty("mrkdwn_in")]
        public string[] Mrkdwn_in { get; set; }

    }

    public class Field
    {
        [JsonProperty("title")]
        public string Title { get; set; }

        [JsonProperty("value")]
        public string Value { get; set; }

        [JsonProperty("short")]
        public bool Short { get; set; }
    }
}

Every Slack message can have zero or more attachments and each of those attachments can have zero or more fields.

Create one more class file in the "Data" folder and name it MessageCreator.cs. We will use it to create different messages, depending on the result. Slack allows a great level of message customization. You can learn more about the Slack message format here.

Our messages will have one attachment with two fields in it - the first field will contain the test list name and the second one the run result:

using ArtOfTest.WebAii.Design.Execution;
using System;

namespace SlackBot.Data
{
    static class MessageCreator
    {
        private const string GREEN = "#7CD197";
        private const string RED = "#F35A00";

        internal static Message GetMessage(RunResult result)
        {
            if (result.PassedResult)
            {
                return CreateSuccessMessage(result);
            }

            return CreateFailMessage(result);
        }

        private static Message CreateSuccessMessage(RunResult result)
        {
            var msg = new Message();

            msg.Attachments = new Attachment[1];
            Field[] messageFields = new Field[2];
            messageFields[0] = CreateHeader(result.Name);

            messageFields[1] = new Field
            {
                Title = $"Result",
                Value = $"All tests passed.",
                Short = true
            };

            msg.Attachments[0] = new Attachment
            {
                Title = $"Test list execution done.",
                Color = GREEN,
                Ts = UnixTimeNow(),
                Fields = messageFields
            };

            return msg;
        }

        private static Message CreateFailMessage(RunResult result)
        {
            var msg = new Message();

            msg.Attachments = new Attachment[1];
            Field[] messageFields = new Field[2];
            messageFields[0] = CreateHeader(result.Name);

            messageFields[1] = new Field
            {
                Title = $"Result",
                Value = $"{result.PassedCount}/{result.AllCount} tests passed.",
                Short = true
            };

            msg.Attachments[0] = new Attachment
            {
                Title = $"Test list execution done.",
                Color = RED,
                Ts = UnixTimeNow(),
                Fields = messageFields
            };

            return msg;
        }

        private static Field CreateHeader(string name)
        {
            return new Field
            {
                Title = $"Test list",
                Value = $"{name}",
                Short = true
            };
        }

        private static long UnixTimeNow()
        {
            var timeSpan = (DateTime.UtcNow - new DateTime(1970, 1, 1, 0, 0, 0));
            return (long)timeSpan.TotalSeconds;
        }
    }
}

As a final step we need to create the SlackClient class. In its constructor we will set the web hook URL. We will add one more method to the class - PostMessage, which as its name suggests, will post messages to Slack:

using Newtonsoft.Json;
using SlackBot.Data;
using System;
using System.Collections.Specialized;
using System.Net;

namespace SlackBot
{
    public class SlackClient
    {
        private readonly Uri _uri;

        public SlackClient(string urlWithAccessToken)
        {
            this._uri = new Uri(urlWithAccessToken);
        }

        //Post a message using a Message object 
        public void PostMessage(Message message)
        {
            var messageJson = JsonConvert.SerializeObject(message);

            using (var client = new WebClient())
            {
                var data = new NameValueCollection();
                data["payload"] = messageJson;
                var response = client.UploadValues(this._uri, "POST", data);
            }
        }
    }
}

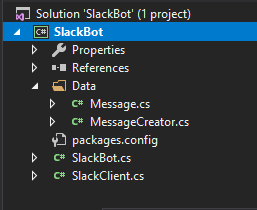
Our final project structure should looks like this:

Project Structure

Using the Extension

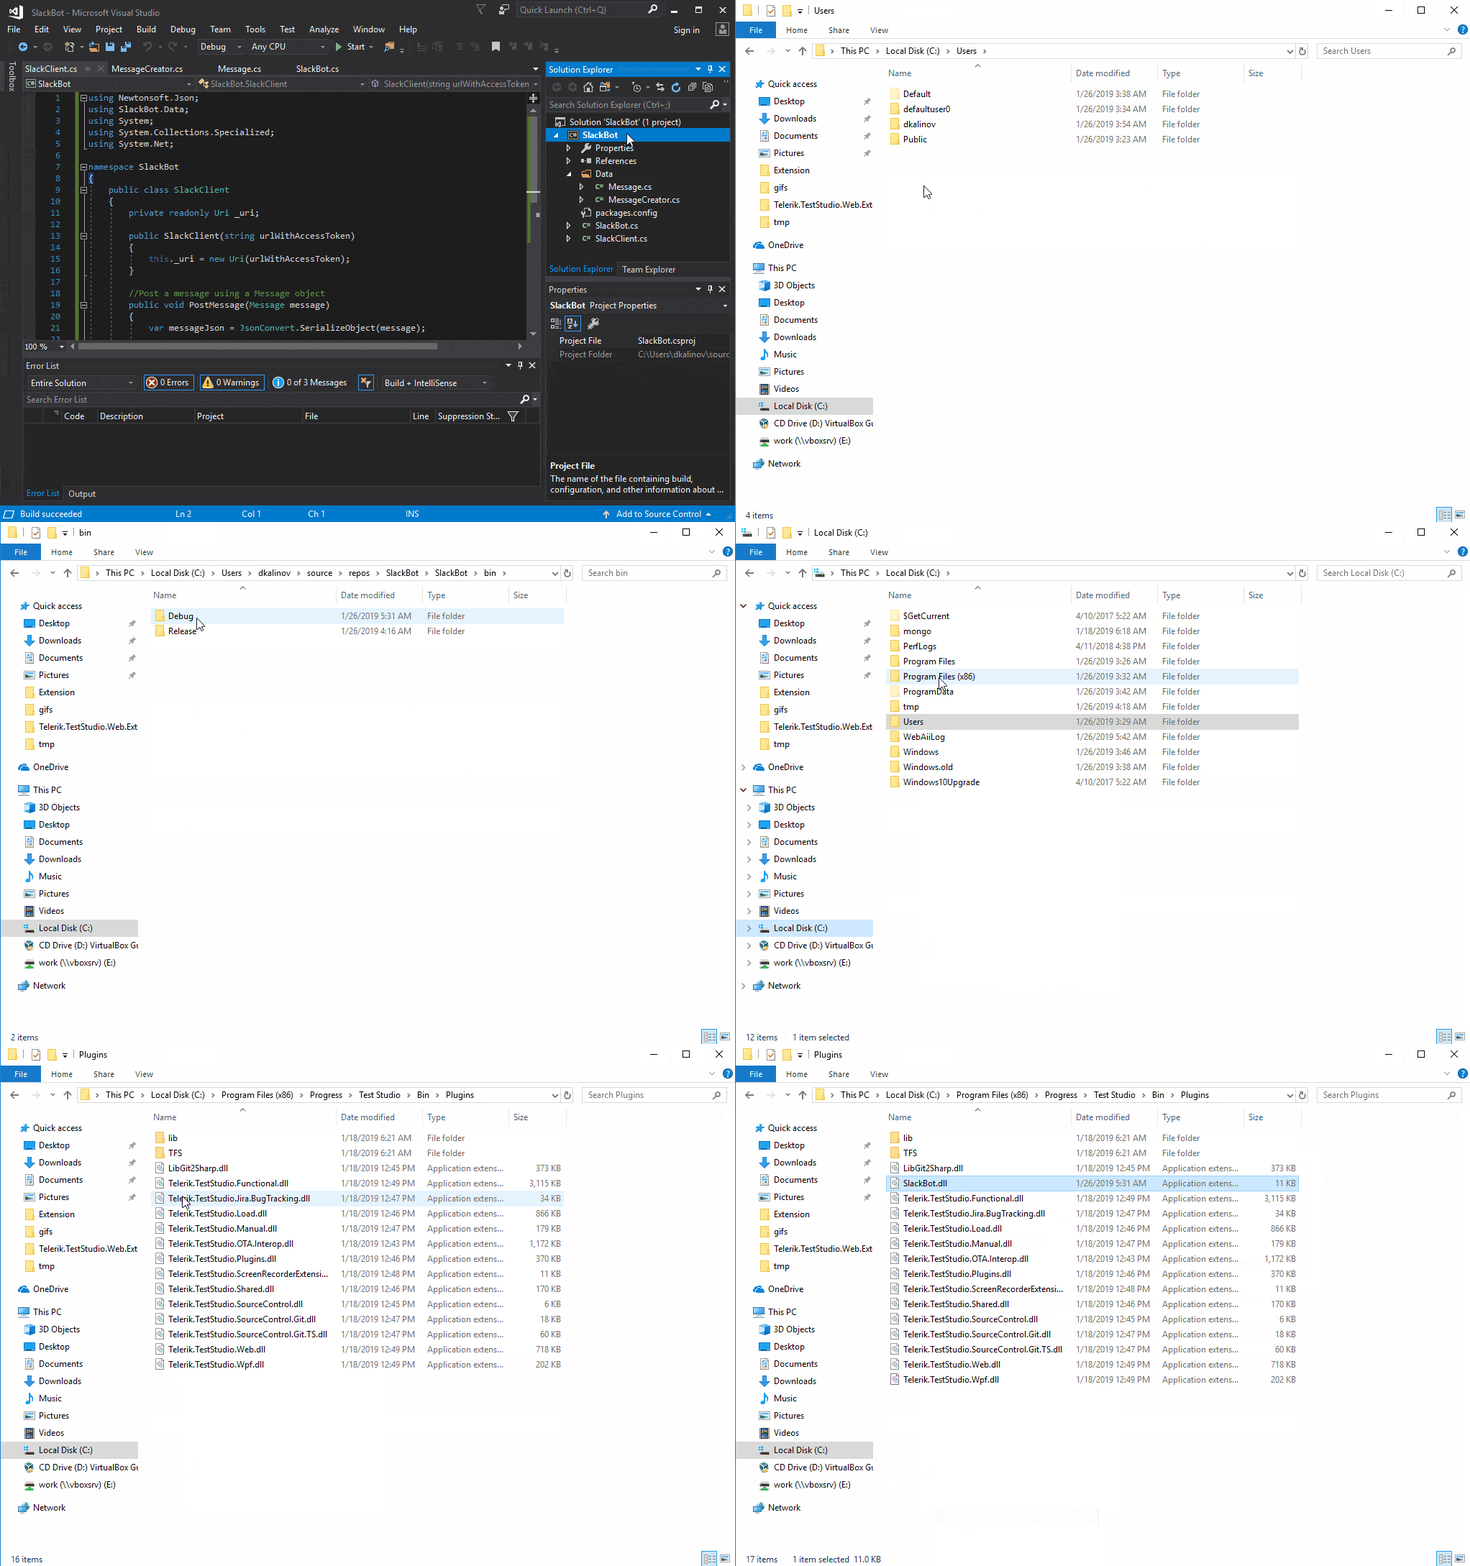
Now we can build our project. In Visual Studio, right click on the project and select "Build." When the build completes, copy SlackBot.dll and paste it into the Test Studio plugin folder (by default it is located in %ProgramFiles%\Progress\Test Studio\Bin\Plugins):

Copy Slack bot dll

Now we are ready to test our extension. Start Test Studio and run one of your test lists.

Run test list

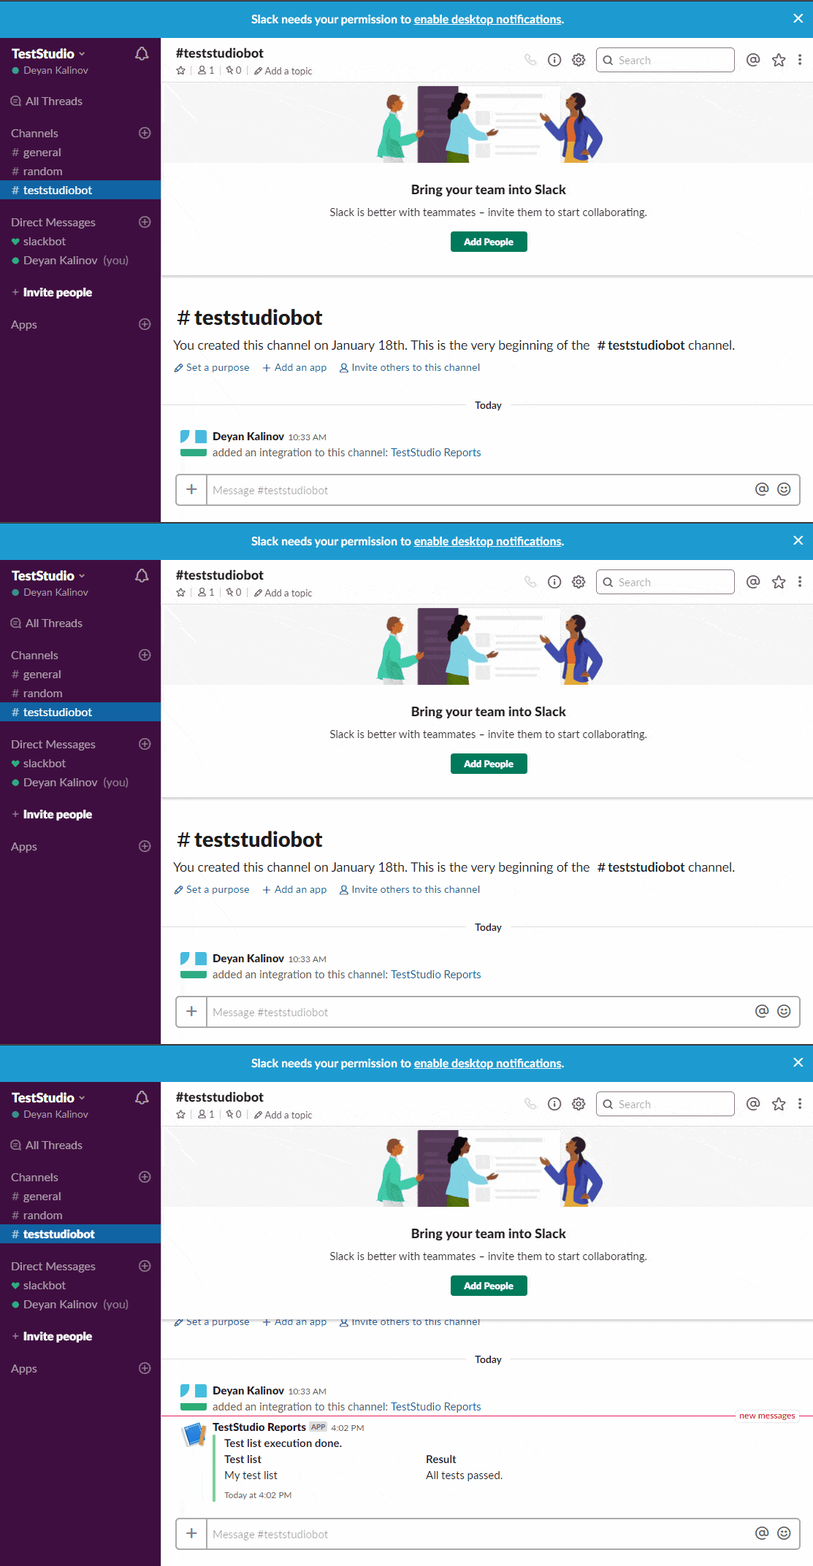
And behold! Your test results are in Slack!

Message received in Slack

Integrating Your Test Results with Slack

Now you saw how easy it can be to extend Test Studio and integrate it with other products.

If you want to try building this extension or creating your own, you can start a free, fully functional 30-day trial:

Try Test Studio

Test Studio R1 2019 Lays the Foundation of an Awesome Year for Testing

$
0
0

The first Test Studio release for the year features UI/UX redesigns for increased user efficiency, a lot of Scheduling improvements, including automatic self-recovery of the execution agent and many more fixes and small features.

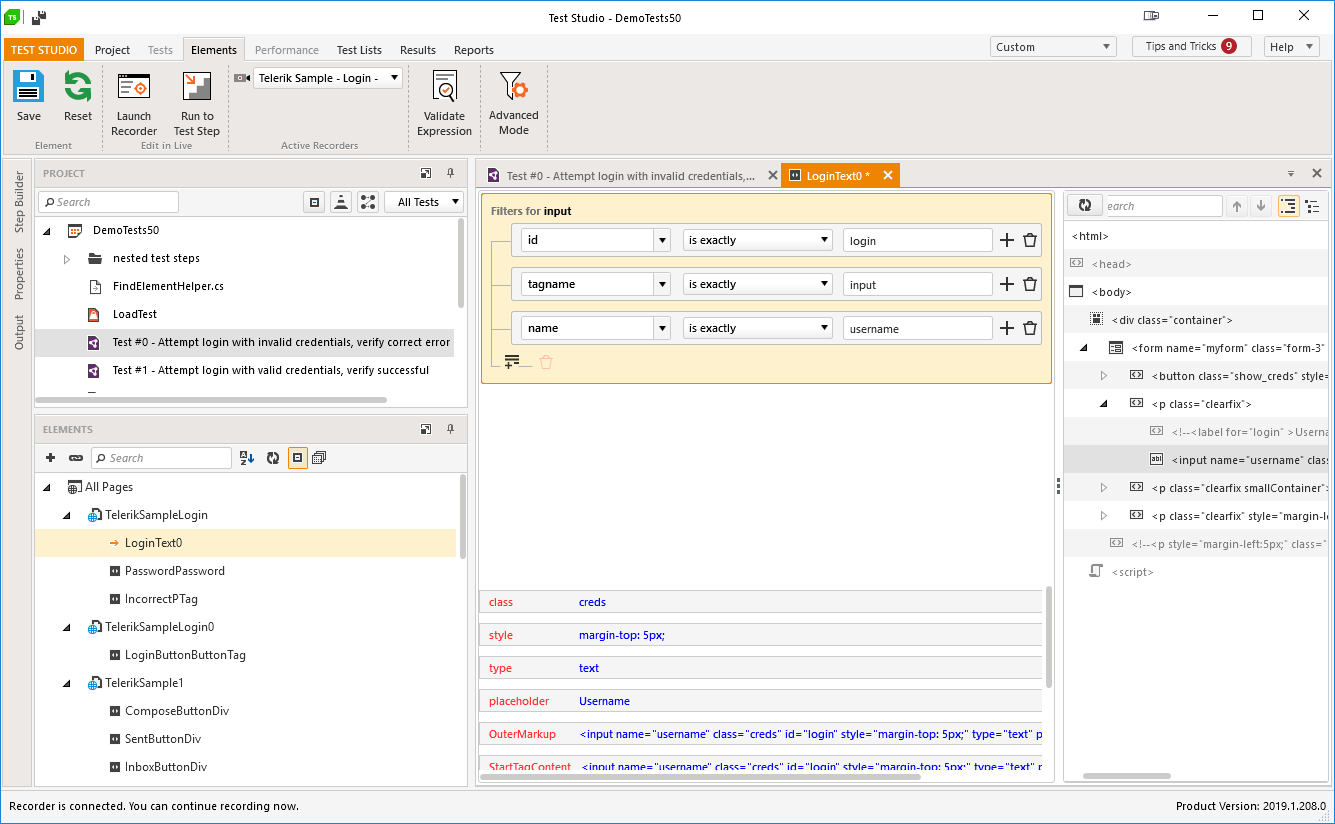
We are starting the year with improvements that not only smarten your daily test automation activities up, but also lay down the foundations for the exciting features coming up in the upcoming 2019 releases. The first major improvement is the re-design of the Find Expression Builder (Edit Element). It is now easier to use it and is ready to host the images that will be part of the image-based element identification expected to come later in the year. Here is an overview of the changes:

Redesigned Find Expression Builder (Edit Element)

We’ve moved it from that old-school dialog to the test area. This means that you can open as many elements as needed, put them side to side to compare or even place them side by side with a test.

The goal of this redesign is to improve usability and make the user’s interaction as simple and efficient as possible. Through removing old and unused parts and exposing the most valued features in the UI we aim to achieve a better user experience.

Find Expression Builder

Scheduling Services Improvements and Self-Recovery Mechanism

Scheduling is now even more stable and easy to setup. Here are the main changes:

  • Execution agent unattended automatic self-recovery: If for any reason the execution agent stops working, it will restart and recover itself and continue executing tests and test lists.
  • Easy and simplified network configuration: Instead of using unlimited port ranges as it used to, all Scheduling bits will now use only three ports – 8009 for the Scheduling service, 55555 for the execution agent, 8492 for the storage service.
  • Improved scheduling runs parallelization
  • General stability/reliability improvements and fixes

Ribbon Menu Improvements

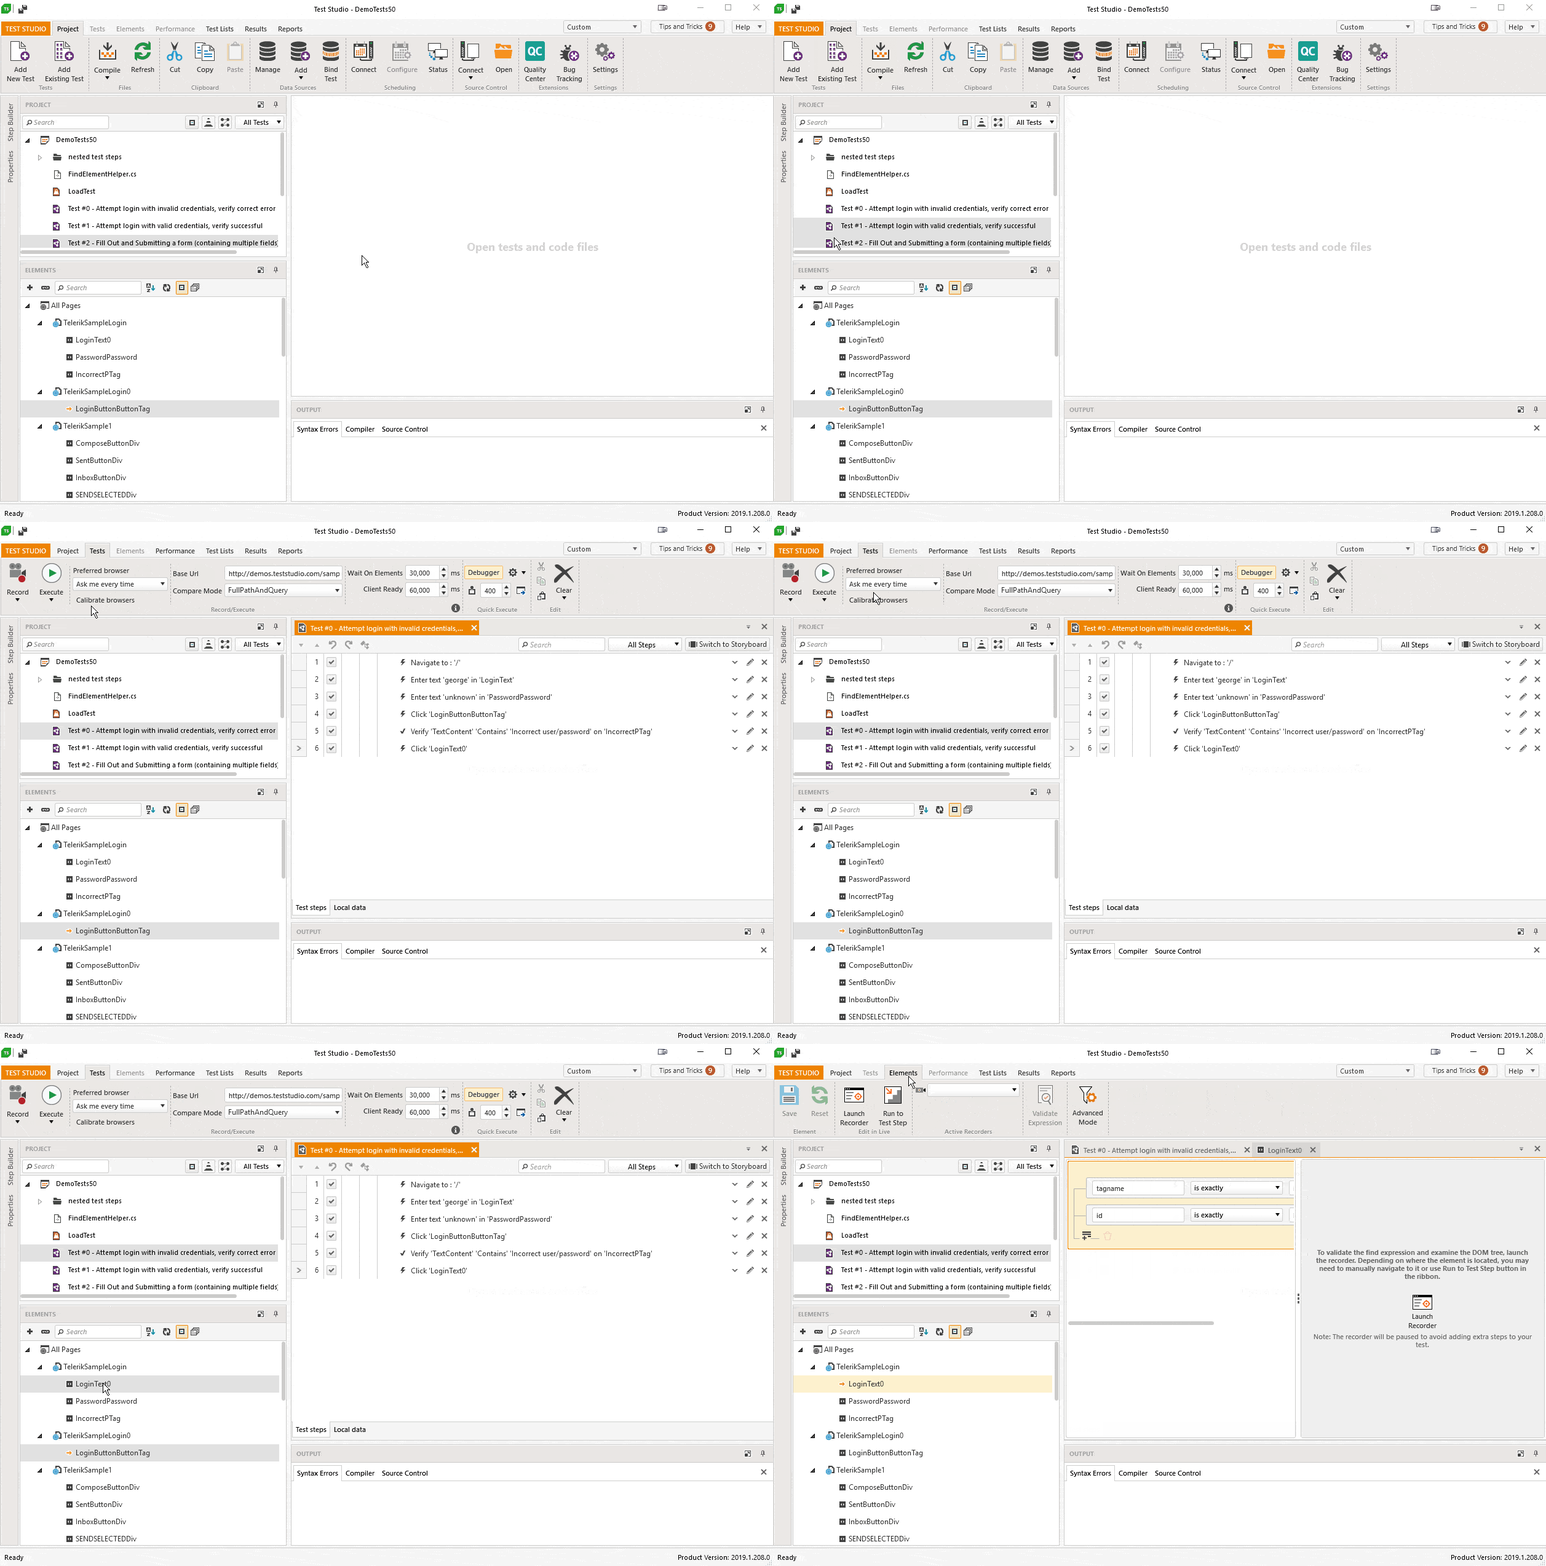
New Project, Test and Element Ribbon menus have been added for improved in-product navigation and usability. The Element Find Expression Builder options and actions are now moved in their ribbon menu on top of Test Studio's window and are easy to access when working with an element.

Ribbon

So Much More

In addition to all above there are a lot more fixes, optimizations and small customer-requested features like support for breakpoints for nested test as steps, global Save All shortcut (Ctrl+Shift+S), KillBrowsersBeforeStart setting for all execution types in Test Studio, Step Builder options to manually add Connect to Pop-Up and Close Pop-Up Window steps, etc. You can see the full change log here.

We would love to hear your opinion, so don't hesitate to let us know what you think. Happy testing!

Try Test Studio

How Smooth Fusion Integrated Automated Testing in Their Process

$
0
0

We on the Test Studio team value our customers and their feedback. While criticism is valuable and helps us craft a better product, it is always a pleasure to hear what is working well too.

Smooth Fusion, a Progress Sitefinity partner, recently decided to start using Test Studio for their test automation and was impressed by the capabilities of the tool and how it helped them release high quality applications. This triggered Brad Hunt, President and Co-Founder of Smooth Fusion to write a blog post for Test Studio.

You can check out Brad's post over on Smooth Fusion's site and see what he has to say (and show) about how Test Studio works for him and his team. It's a great read and we appreciate the time he took to write it.

If you want to try Test Studio yourself, start a free, fully functional 30-day trial here:

Try Test Studio

How to Test Live Services with Fiddler AutoResponder

$
0
0

It’s always a challenge to test app features that go outside the scope of your local environment. In this post I’m going to talk about how we test our product automatic updates that use AWS (Amazon Web Services).

Simply put, our app will send a request to AWS and check if there is a new version of the product. If there is one, a specific behavior will activate locally, and an event will trigger on the local machine. What I as a QA engineer would like to test if these events trigger correctly.

Here lies the challenge though. It is not so easy for me to simulate the real life scenario - I’ll need to create a test environment for this service, an engineer will need to create a new build flavor of the product that is set to make requests to this new test environment, I’ll need to communicate with the Admin team in order to get permissions for our AWS account, and maybe few other things that will come up in the whole process. Or… I can avoid all that setup and make things a lot simpler and easier by using Fiddler instead.

Fiddler is a free tool and one of its powerful features is the ability to capture specific requests and return custom tailored responses to the client issuing the requests. Basically, it can act as man in the middle and this is very useful for testing. The AutoResponder can mock external services and help with testing specific behaviors triggered by responses from external providers.
It’s also useful if you are in the development phase where your feature is ready for test, but the web service is still not Live. Are you going to wait for the devops guys to setup everything or you will use Fiddler to create a mock response and complete most of your testing?

morpheus

I’ll show you an example of a real-life scenario and how I use the AutoResponder feature in my own testing. I’ll explain where the AutoResponder is in Fiddler, how to set it up and some of its useful options.

The AutoResponder tab is here:

1

You can manually add a request to match or import a set of recorded requests from a Fiddler archive. For the sake of the example I’m going to create a new rule. Setting up the rule is very simple. You just need to insert the request you need to intercept - in my case it is a request to AWS like this <https://telerik-teststudio.s3.amazonaws.com/TestStudioVersionManifest>:

2

The next step is to select what kind of response you want to get when Fiddler matches and intercepts this request. Here is where it gets interesting, as there is a lot of freedom in terms of what you can do depending on the situation. Editing the response, you can set specific errors like 202, 403, 502, etc. This is especially useful for negative test scenarios.

In my case I need this request to return a specific manifest JSON which tells the desktop app if there is a new version available for download. This is us testing a “check for update” feature after all:

3

It’s important to check “unmatched requests pass through,” as this will allow your normal requests to pass unobstructed through the Fiddler proxy:

4

This is mandatory for this example only. There are scenarios where you will probably need to stop all other requests from your machine and allow only the ones set in the AutoResponder.

Another interesting and useful option is to simulate Latency for the response request. This allows you to test how your app handles unexpected latency problems. Does it timeout gracefully? Does it recover as expected? Who knows? You will know if you test any outbound requests with the simulated Latency:

5

Easy Testing of Live Services with the Fiddler AutoResponder

In conclusion, the AutoResponder feature in Telerik Fiddler is very useful in cases where you need to mock a service, and then get a specific response during development by reaching an endpoint which is not ready for deployment on the Test/Live environments. It is also useful in negative testing scenarios or any tests where you need to simulate certain network conditions like slow network, random network errors and such.

If you have any feedback or comments, let us know in the comments below.

How I Transitioned from Support to QA, and Automating Testing

$
0
0

In this post I will share how I started my career as a Quality Assurance Engineer, and also show you how to automate a form registration with multiple random users.

I work as a Senior QA Engineer in Progress on the Test Studio team - the best team I’ve ever worked with. When I say the best team I really mean it.

You’ll ask what makes one team the best, and I’ll say friendship, empathy and trust, because apart from being colleagues we are primarily human beings. Relationships are very hard to form and it’s the little things that matter, for example, exchanges like: 
Hey did you get that problem fixed?
Oh my god, I didn’t, I am kind a stuck here.
Can I help you out with that?
Really? That will be great, thanks!”

 Or

Hey you look worried and tired, is everything OK with you?
Yeah, I just didn’t get enough sleep last night.
Here, I got you a coffee, hope it will help you feel better.
Thanks, man. I really appreciate it!

That’s how you form relationships, that’s how trust forms. Trust isn’t formed in an event, in a day, even bad times don’t form trust immediately, it’s the slow and steady consistency. But enough about our team. Let me tell you how it all started for me.

Back in 2012 I was moving back to Sofia, Bulgaria after one year working on personal projects, and I was looking for a new job and new opportunities. Until then my main experience was as a technical support in a hosting company, but I wanted something new, something different and something challenging. A friend of mine told me:

Why don’t you become a QA engineer? I work as a QA engineer, it is a great profession with a lot of opportunities for growth and further development.”

Then he explained to me a bit more about what QAs do and gave me a small introduction of testing a web login form along with multiple examples of different login scenarios in terms of GUI & Functionality, Security, Session and Browser.  

Excited about everything I heard I started applying for QA jobs and going on interviews. However, knowing only how to test a login page without any other testing experience was not enough. I had no idea about terms such as black box testing, regression testing, functional and load testing, data driven testing and so on. I had no previous experience with automated testing tools and automated testing in general, and with such a lack of testing experience I was not confident in interviews.

One day browsing the job listings I noticed a technical support position in an automating testing team. The team was Test Studio. I decided to go the smart way rather than the hard way and apply to the support position with the idea to transition to a QA position. My experience with dealing with customers and technical background got me on board, and this is how I started working with Test Studio.

Part of my responsibilities as a support engineer in Test Studio included helping clients accomplish their testing goals, properly maintaining testing projects and suites, and logging product defects and feature requests. The more I worked as support engineer the more I was getting confident that transferring to QA position was something I really wanted.

I initiated a check-in meeting with my direct manager to discuss my OKRs (Objectives and Key Results) and my personal development in the company, and I shared my desire to become a QA Engineer. Luckily at that time the team needed another QA Engineer and my request for transition was accepted.

Along with my daily tasks as a support officer I was assisting QAs in logging defects, helping with regression testing and getting familiar with the automation project and QA process in the team.

Meanwhile in my spare time I took an ISTQB course and a Selenium course. It turned out that Test Studio outperforms Selenium because it enables QA engineers to use built-in record/execute functionality, load and performance testing, API and mobile testing.

Automating a Form Registration

Before my transition into a full-time QA position once I had to automate a sample scenario – a registration form with multiple registered users. The small challenge here is that you need unique users for each registration, otherwise you’ll get the warning that the username already exists.

It turned out that with Test Studio this task is piece of cake. You start by creating your test using the recording functionality and by adding a coded step. The created test should look like this:

teststeps

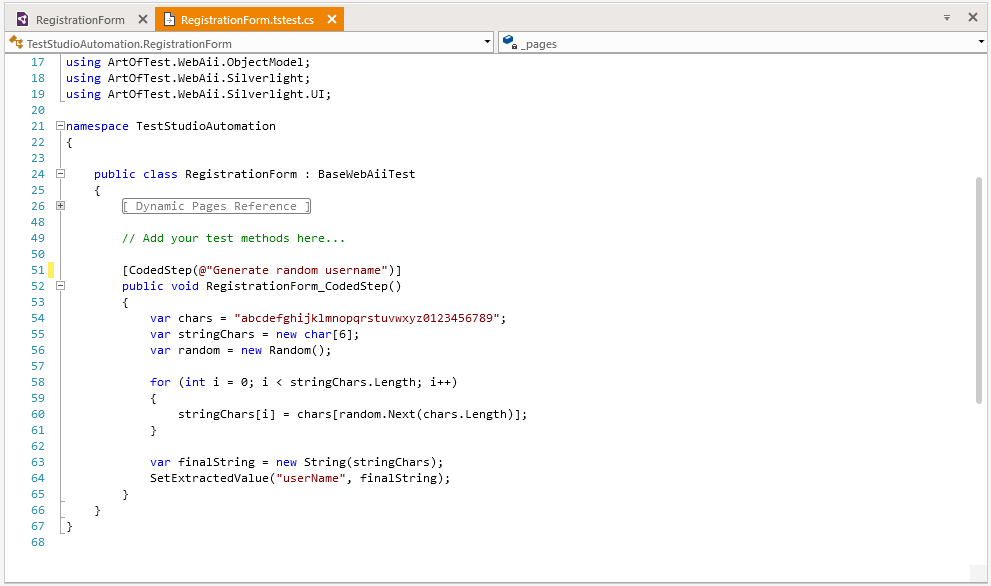
You’ll need the coded step because you’ll have to use a sample code snippet which will create a random username using set of characters and will assign that username to an extracted variable for further use in the test. This is a very good example of how powerful the mixed approach of recording plus code is.

The coded step looks like this:

coded step

The last line of the code snippet sets the randomly generated string as a value to extracted variable userName. Now the variable can be used in the entering username step (Step 3) using the step properties:

databind

Once done, every time you execute the test a new random username will be generated and used for registration.

Using variables in the test execution is one of the many features of Test Studio which you can use and ease your testing.

If you're new to Test Studio, you can download a free 30-day trial and get started with this example today - just click the link below.

Try Test Studio

Test Studio Gains Visual Studio 2019 Support in Latest Service Pack

$
0
0

The newly released Test Studio Service Pack brings support for Visual Studio 2019, and a nice list of fixes and optimizations.

Visual Studio 2019 Support

The Test Studio R1 2019 Service Pack 1 is now live and ready for you to download. A highlight of the new SP is support for Visual Studio 2019. Microsoft just released Visual Studio 2019 and as a rule Test Studio's team immediately drops a new product build to support it. You will be able to export projects from Test Studio or directly create them inside Visual Studio 2019.

Other Highlights

In addition to this there are numerous other fixes, enhancements and memory footprint optimizations inside the:

  • Application UI
  • Recorder
  • Find Expression (Element) Builder
  • Scheduling
  • Test Studio for API

For the full list of fixes click here.

Share Your Feedback

We always love to hear your opinion, so don't hesitate to let us know what you think. Try the new SP out by updating today, or if you're new to Test Studio feel free to download a trial of the latest version. Happy testing!

Try Test Studio


Innovative Technology in the Latest Test Studio Release Revolutionizes UI Test Automation

$
0
0

An industry-first combination between attribute-based and image-based element identification drastically reduces test failures and lets you focus on the real bugs instead of tedious test maintenance. Learn how it works and what else is new in the R2 2019 release.

Quality assurance engineers report that one of their biggest pains is dynamically generated element attributes or application changes that lead to missing elements and, of course, failing tests. The elements are actually not missing, they are there, but their attributes have changed, and therefore the the correct find logic does as well, and our automation script just cannot find them anymore. This can mask a real bug and usually all the QA’s time for creative testing and bug investigation goes into test maintenance.

So, bugs slip into production, and meanwhile you are digging into the scripts, fixing elements instead of doing something more fun and creative and at the end of the day – so much work, not that much product quality. I know, you’ve felt that pain. But what we can do about it?

ConfusedNinja

We found the solution – it consists of well-known bits and pieces but combined in a new, innovative way. Currently, today’s tools and frameworks give you choice between attribute-based and image-based element find logic, and you need to choose one or another. Both approaches have their strong and weak spots and there is always some trade-off. We put some serious effort into tackling this and combined both into one, making test failure due to missing elements almost impossible.

So, what’s the idea? Test Studio uses a unique combination of element attributes to identify elements, which works very well in most cases. But sometimes an ID will turn out to be dynamically changing or a developer would change something and the test will fail. Here the new tech comes to the rescue. During test recording Test Studio will record also images for each element. When the traditional find logic fails it immediately tries to find the respective image, then we identify the element that stands behind it and execute the step, no matter if it is a simple click, type, button toggle or a more complex grid filtering change, for example. The test will pass with green status with just a warning letting you know that there was something odd along the way.

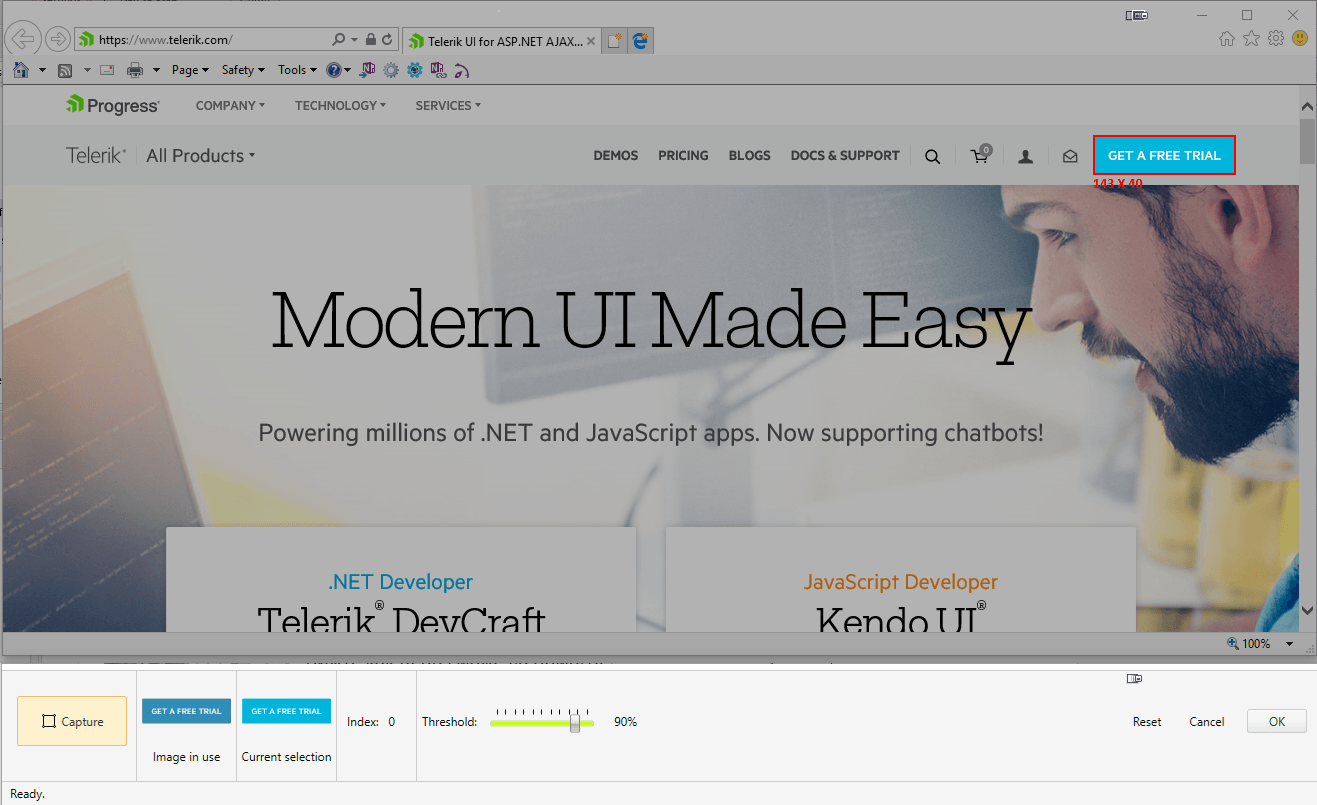
You can add a new element image or edit and update already recorded one either by directly uploading a new file or by using our brand-new in-house image recorder.

Recorder

If this is not exciting enough we also added several other very handy updates to the product:

  • New in-product help guides. Click on the rocket button inside Test Studio panels for some relevant help info. rocket
  • Visual Studio 2019 support.
  • Stability and performance improvements to the Results view when large number and large in size results are being loaded and reviewed.
  • Three brand new guided end-to-end scenario tutorials. Run them from the Get Started tab of the Welcome Screen
  • Ability to copy/paste and multiselect dynamic target items inside Load Testing.

With these exciting updates and the remaining fixes and improvements we, the Test Studio team, believe that we are making the lives of you, our customers, easier. We would love to hear your opinion, so don't hesitate to let us know what you think.

Happy testing!

Try Test Studio

Image-Based Element Identification by Test Studio

$
0
0

The latest and greatest Test Studio feature is finally out! Say hello to the industry-first combination between attribute-based and image-based element identification that will significantly reduce your maintenance time and make your tests more stable than ever before.

“The first rule of any technology used in a business is that automation applied to an efficient operation will magnify the efficiency. The second is that automation applied to an inefficient operation will magnify the inefficiency.”

—Bill Gates

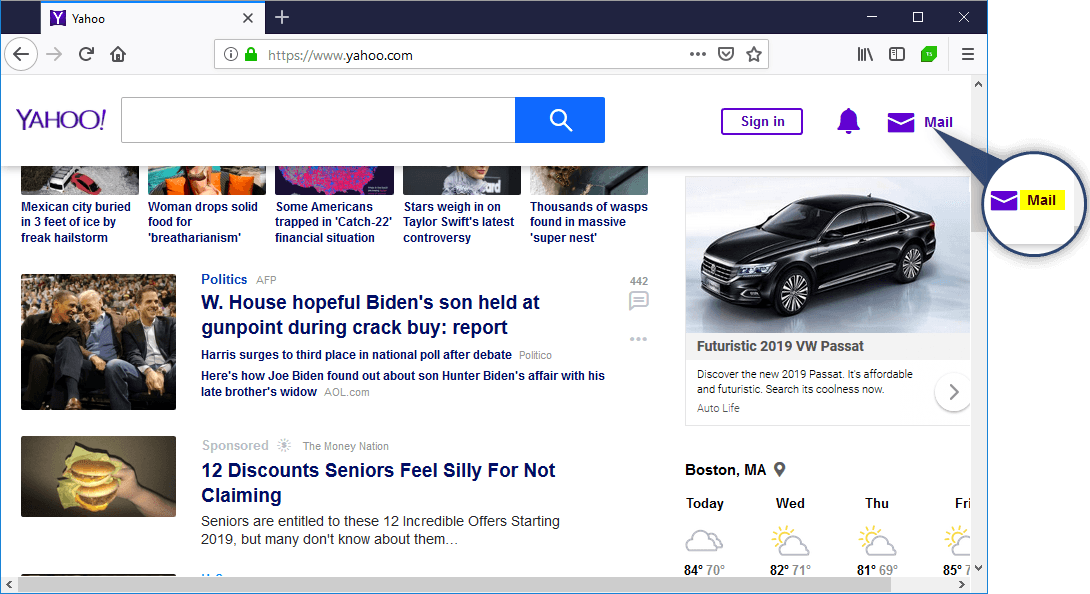
Very often when we, the QA engineers, automate a feature and run the successfully recorded test for a first time we get a red result. Upon further investigation it turns out we are dealing with dynamic elements. Dynamic elements are elements whose attributes change every time you reload the page, and these attributes can be but are not limited to ID, Class Name, Value etc. So you cannot handle dynamic elements simply by their locators.

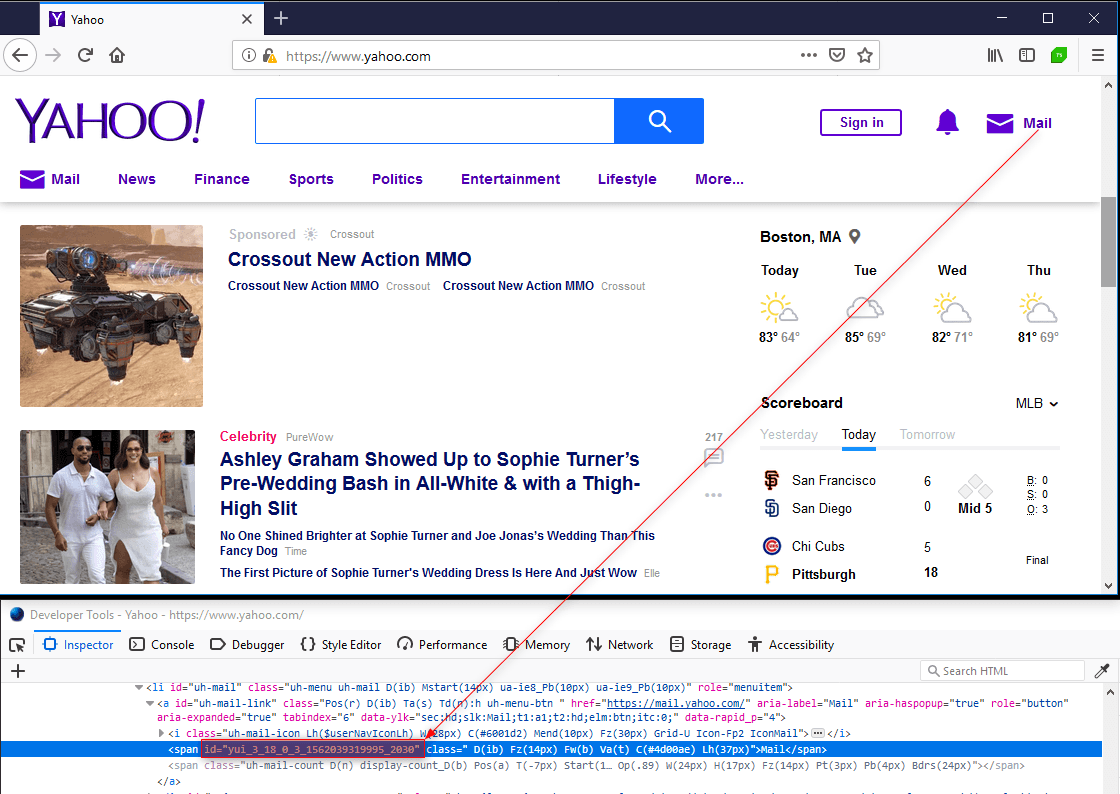
For example: All menu items on Yahoo’s home page are using dynamic ID’s as shown in the screenshot below

yahoo

<spanid="yui_3_18_0_3_1562039319995_2030"class=" D(ib) Fz(14px) Fw(b) Va(t) C(#4d00ae) Lh(37px)"> Mail</span>

Using the ID locator here will result in test failure the next time when you execute your test. In such cases the ID is not the most reliable locator you have to use when creating your test case.

Let's review the most common techniques to handle such problems using any automation tool, and how this was done with Test Studio prior to the recent R2 2019 release.

Absolute XPath

Absolute XPath starts with the root of the HTML page.

Example:

/html[1]/body[1]/div[2]/div[1]/div[1]/div[1]/div[1]/div[1]/div[1]/div[2]/div[1]/ul[1]/li[3]/a[1]/span[0]

However, Absolute Paths are not recommended most of the time because:

  • Absolute Paths are not reliable because a minor structural change results in different Xpath for the element
  • Absolute Paths are long and this makes them hard to read

Note: Absolute Paths should be used only when a relative Xpath cannot be built. 

Relative XPath

Relative XPaths are used for locating an element with respect to an element known as XPath. The element of your choice is referred relative to a known element. Relative Paths start with two forward slashes “//

Example:

//a[@id="uh-mail-link"]/a/span

With the relative Xpath above we are first locating the parent anchor element with id uh-mail-link and then we locate the span element we would like to work with.

With the relative Xpath you can build quite robust find logic and thus more reliable tests.

Unfortunately, there is always a case where even the relative Xpath will not help. Imagine a developer decides to rewrite certain functionality and even if the web page design looks the same, something in the code behind is changed affecting your existing tests. 

In such cases even if you are using CSS selectors instead of Relative Xpath you will still end up with failing tests as CSS selectors rely on CSS classes and element structure.

Wait a Minute! Stop this Endless Test Maintenance!

With the new Test Studio R2 2019 release you can avoid all those struggles mentioned above as we have introduced an industry-first combination between attribute-based and image-based element identification. This drastically reduces test failures and lets you focus on the real bugs instead of tedious test maintenance.

Nowadays all modern automated testing tools and frameworks either work with attribute-based find logic or image-based find logic. We from Test Studio put some serious thought into making the find logic experience as user friendly as possible, and decided to combine both approaches into one. The result is that test failures due to missing elements almost impossible.

So What’s the Idea?

Test Studio uses a unique combination of element attributes to identify elements, which works very well in most cases. But sometimes an ID will turn out to be dynamically changing or a developer would change something and the test will fail. Here the new tech comes to the rescue. During test recording Test Studio will also record images for each element. When the traditional find logic fails it immediately tries to find the respective image, then we identify the element that stands behind it and execute the step, no matter if it is a simple click, type, button toggle or a more complex grid filtering change, for example. The test will pass with green status with just a warning letting you know that the traditional find logic failed.

You can also add a new element image or edit and update an already recorded one either by directly uploading a new file or by using our brand-new in-house image recorder.

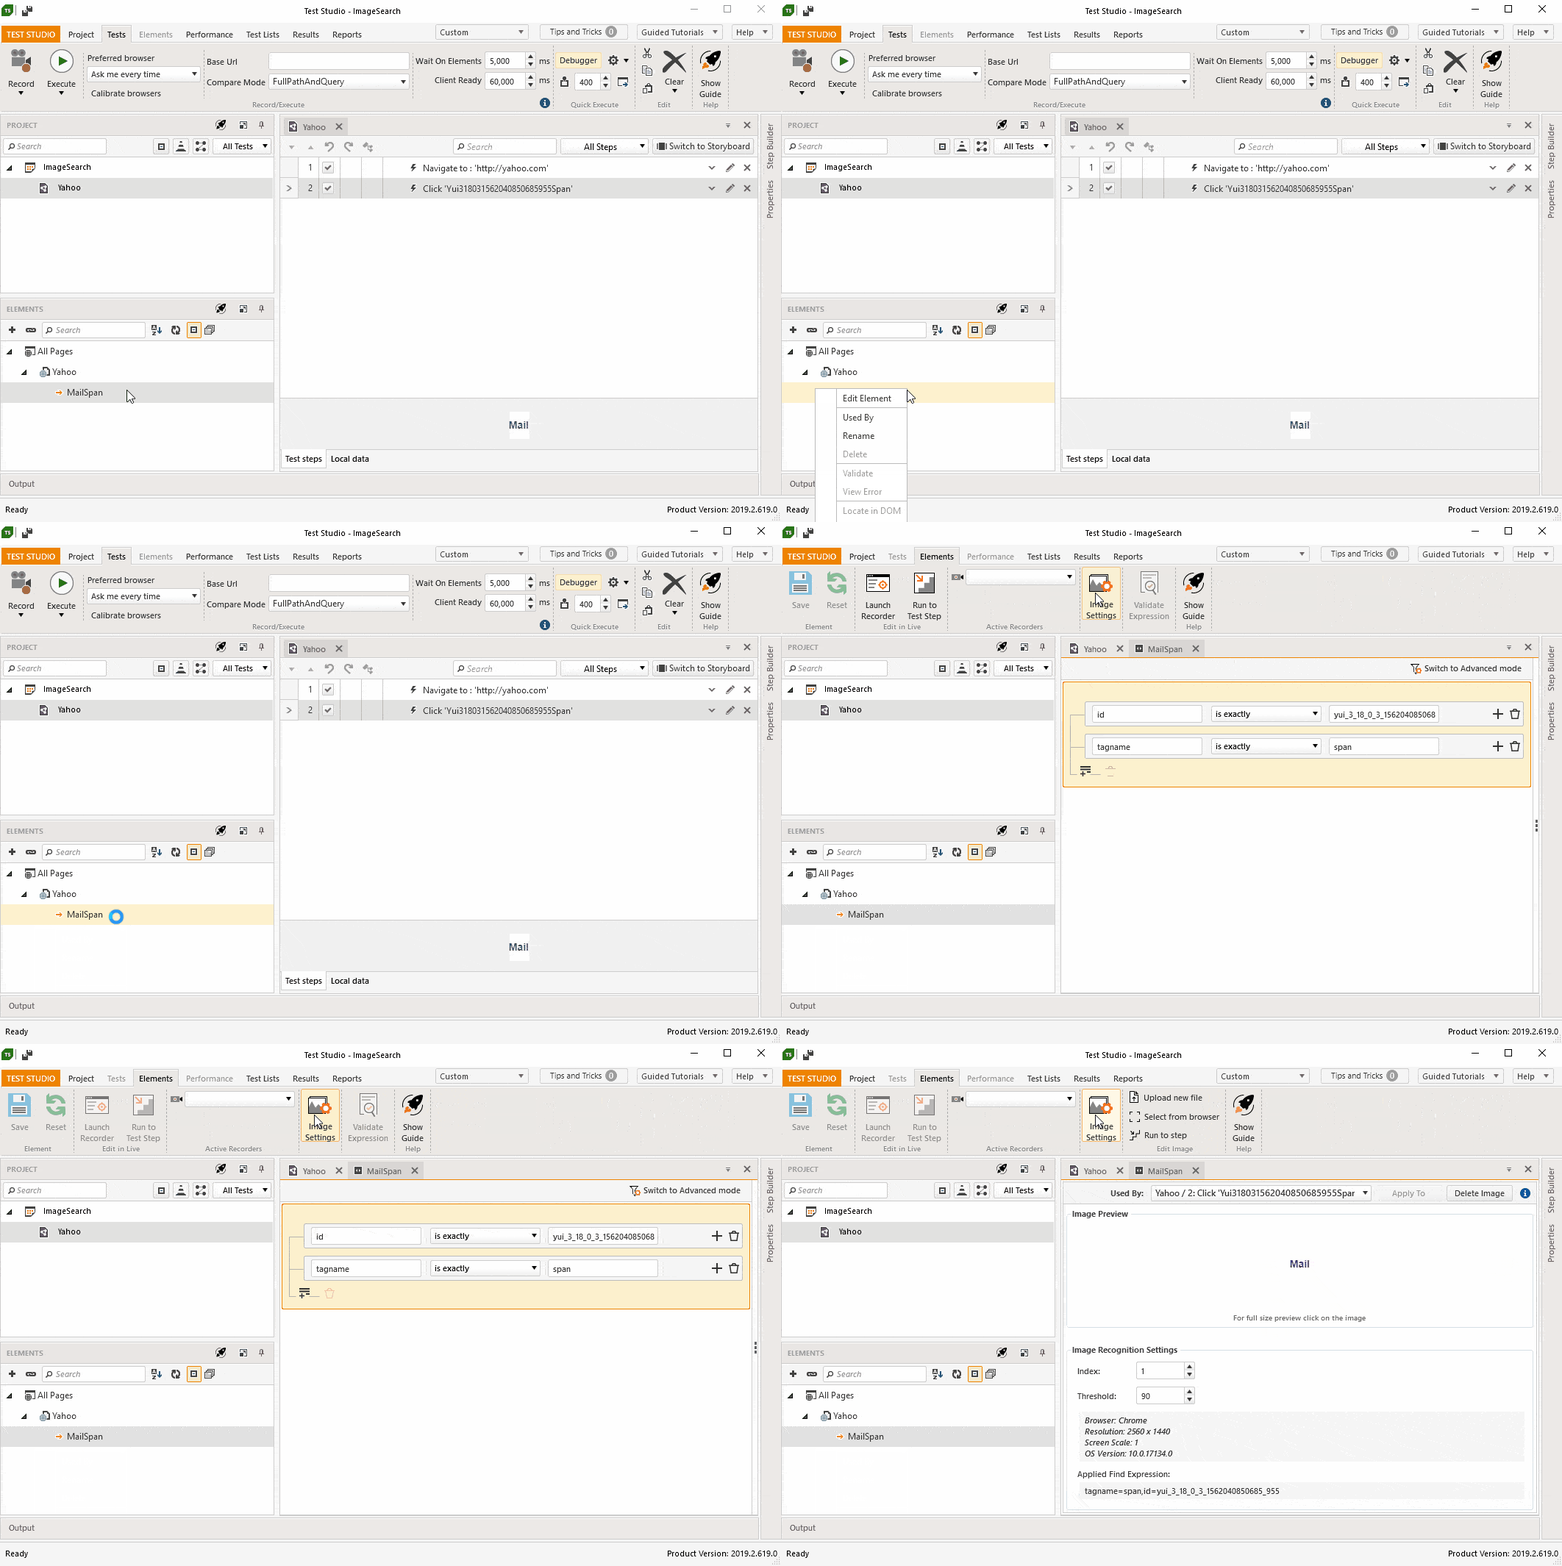
In Practice

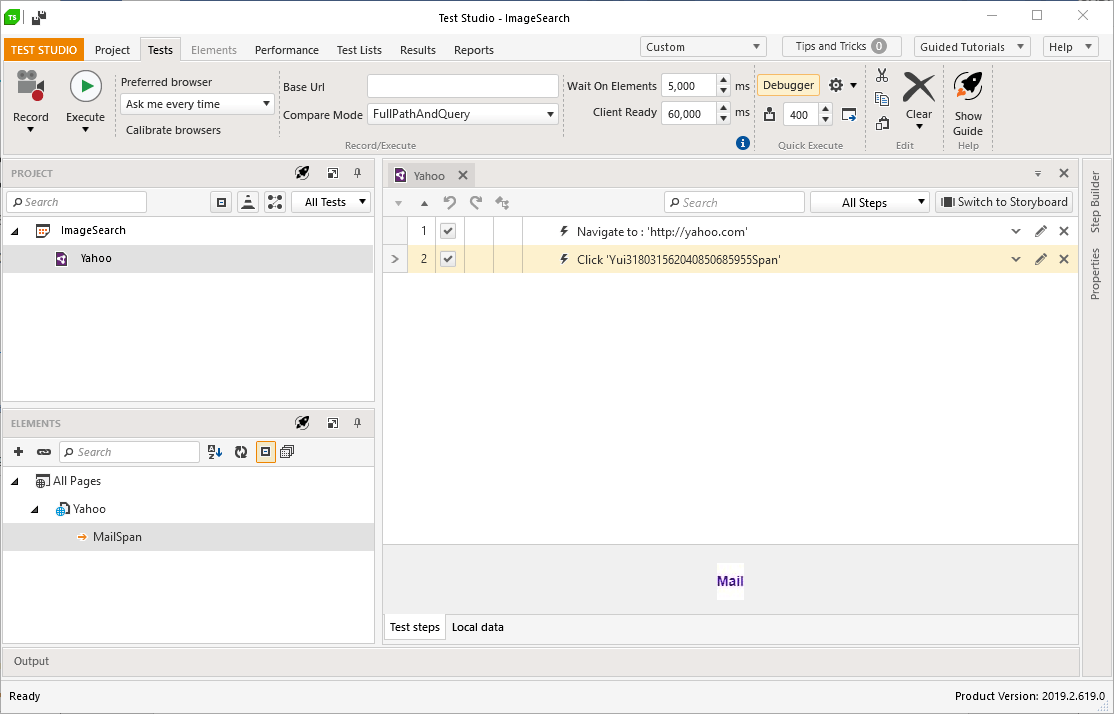
Using Yahoo’s website and Test Studio I have recorded quite a simple scenario navigating to http://yahoo.com and clicking on the Mail element in the upper right of the index page.

Magnifier

In Test Studio this represents with two steps, one Navigate step and one click step:

TestStudioRecordedTest

The tricky part and where our new feature really shines is when you edit the recorded MailSpan element. Along with the auto-generated find expression by ID and Tagname we have an image attached to the element (see the animation below). Now if you execute the test the applied find expression will fail due to the dynamic ID part, but Test Studio will switch automatically to search by image and will locate the element which will result in successful test execution.

ImageSearch

We on the Test Studio team hope this innovative technology will revolutionize UI test automation for you, helping all our customers build more robust test cases and reduce the countless hours spent on test maintenance.

You can find more about working with image-based element identification in Test Studio using this KB article!

Happy Testing!

If you want to try our find element by image feature you can start a free, fully functional 30-day trial:

Try Test Studio

Improve Your Remote Test Execution with Test Studio User Session Configuration

$
0
0

Executing UI tests on a remote machine has never been easier. Learn how to save yourself a hassle with the great features for user session configuration in Test Studio.

There is a particular challenge involved with running UI tests. Usually, UI tests involve simulating actions with the mouse or keyboard or sometimes taking screenshots of the current desktop. To ensure these will function correctly, we need to have an active desktop session that renders the GUI.

Most of the time we would want to run our tests on a virtual machine and connect to that machine remotely when an interaction with it is needed. The problem is that when we use Remote Desktop Connection (RDC) to setup the machine and we finally disconnect our RDC session, our session on the remote virtual machine gets locked out and its operating system stops rendering the GUI for the running applications in our session.

The same thing happens if we leave the RDC session open, but the remote OS gets locked due to inactivity, e.g. while waiting for the next test run to start. In that case, UI tests cannot simulate GUI interactions and will fail with a “SendInput: Failed. Win32Error” error. If we try to take a screenshot of the desktop at that moment, it will appear black.

Keep Machine Awake

To ensure our UI tests will be executed, we need, first, to make sure our desktop session does not get locked out, the machine won’t go in sleep mode, and a screensaver will not appear.

The obvious solution to that is to modify the system settings of our machine, but we might not want to permanently change those settings, or we might not even have the proper administration permissions to do that. To save us the hassle of changing our system settings for sleep/lock timeout, Test Studio now has the “Keep Machine Awake” setting.

To access the “Keep Machine Awake” setting, we need to start the Test Studio Execution Server (Click on the Windows Start Button, type “Start Execution Server” and click on the result) and open it from the Windows Task Bar (click ‘Show’ on the Test Studio icon).

Keep Machine Awake - Test Studio

When “Keep Machine Awake” is enabled, this will prevent our Windows machine from falling to sleep, locking or showing a screensaver for as long as the Test Studio Execution Server is running. (Unless, of course, we deliberately lock the machine.) In general, Test Studio will do the same thing that happens when we run a video player on our machine for example. To allow your machine to sleep/lock normally, we need to turn “Keep Machine Awake” off or just stop the Test Studio Execution Server.

The “Keep Machine Awake” option should be used with caution though, since keeping a machine unlocked while being unattended might be a security risk. Any person with physical access to a machine where “Keep Machine Awake” is enabled might be able to interact with the machine.

Reconnect to Console Session

First of all, what is the console session? The console session is the one that we would see on the physical monitor of a Windows computer, working with the physical keyboard and mouse of that computer. In other words, this is the one session that uses the physical console of a computer. Whenever we connect to a Windows computer via Remote Desktop Connection, that would create for us a separate RDP session. So, when we need to disconnect our RDP session, we have to redirect our session to the physical console in order for the GUI of our running applications to keep being rendered.

As we mentioned in the beginning, keeping an active desktop session while working with a virtual machine via RDC has been a challenge so far. Until now, there have been several options to solve that problem:

  • One option would be to use an additional virtual machine as a “proxy” (as described in this article) and keep an always open RDP session to our execution machines. While this approach still works, it introduces an additional level of complexity in the process of maintaining execution machines.
  • Another option would be to install a VNC server on the execution machine and configure it to run as a service. VNC uses the console session and even if we are not connected to that machine from a VNC client, our UI tests would still have access to the GUI. The problem with this approach is that on non-Server editions of Windows, only one active session is allowed. Therefore, whenever a user connects to that machine via RDP, that will force VNC’s console session to be locked and our UI tests would fail.
  • Finally, we could end each RDC session by invoking the following command from Windows Command Prompt to switch to console session: 

    %windir%\System32\tscon.exe RDP-Tcp#<<add-your-session-ID-here>> /dest:console

    This approach is error prone though, as it requires the user to remember to quit their session using the command instead of just closing their RDC session.

The “Reconnect to Console on Disconnect” option makes things much simpler. Just like the “Keep Machine Awake” setting that we discussed above, to enable “Reconnect to Console on Disconnect,” we need to start the Test Studio Execution (Click on the Windows Start Button, type “Start Execution Server” and click on the result) and open it from the Windows Task Bar (click ‘Show’ on the Test Studio icon).

Reconnect to Console on Disconnect - Test Studio

With the “Reconnect to Console on Disconnect” option enabled, Test Studio will automatically reconnect our RDP session to the console session every time we close the Remote Desktop Connection window. We can connect to the execution machine with RDP as many times as we need and every time we disconnect, our UI tests will be able to continue running without interruption.

Warnings

When “Reconnect to Console on Disconnect” is enabled, Test Studio will reconnect our RDP session to console in an unlocked state. That means that whatever we were seeing when working with Remote Desktop Connection, will be displayed on the physical monitor of the execution machine (if there is one). Any person standing next to the execution machine’s physical console will be able to interact with it. Please have this in mind in case this could be a security risk for your organization.

Minimizing the RDC Window

There is one case when “Reconnect to Console on Disconnect” will not be able to help us to keep our UI tests running. That is when we are using RDC and minimize its window on our machine instead of closing it. This will not disconnect the RDP session and Test Studio will not be able to switch it to console. At the same time, the Windows OS of our client machine will force the remote session to switch to GUI-less mode and will stop displaying windows and controls. To overcome that limitation, we would need a little tweak in the registry settings of our local client machine. Please check our KB article on how to do that.

Monitor Session State

Once we have our execution machines set up, we can monitor their state from the Remote Execution Status window. While the “Status” column shows the overall state of the machine (whether it is alive and reachable), the “User Session” column shows the state of the user session. This lets us inspect from a single place if all execution machines are properly configured and ready to execute tests.

Remote Execution Status - Test Studio

If an execution machine is shown with User Session “Disconnected,” that means that the last RDP connection to that machine was disconnected, but the “Reconnect to Console on Disconnect” setting is not enabled. Therefore this machine will not be able to render GUI and tests that depend on it would fail.

We're always working to make testing easier for you on the Test Studio team, and we hope this post has given you a good overview of how you can easily execute UI tests on a remote machine with Test Studio. If you're new to Test Studio, you can get started with a free 30-day trial today.

Web-Based Results and Much More in the Latest Test Studio Release

$
0
0

Test Studio has been providing outstanding test automation capabilities to QA engineers for more than 10 years now. In the latest release, we provide even more value not only to the QA but to all other stakeholders in a project – PM, Developer, Management, etc. Let me present to you the Executive Dashboard.
Learn more about it and what else is new.

Executive Dashboard

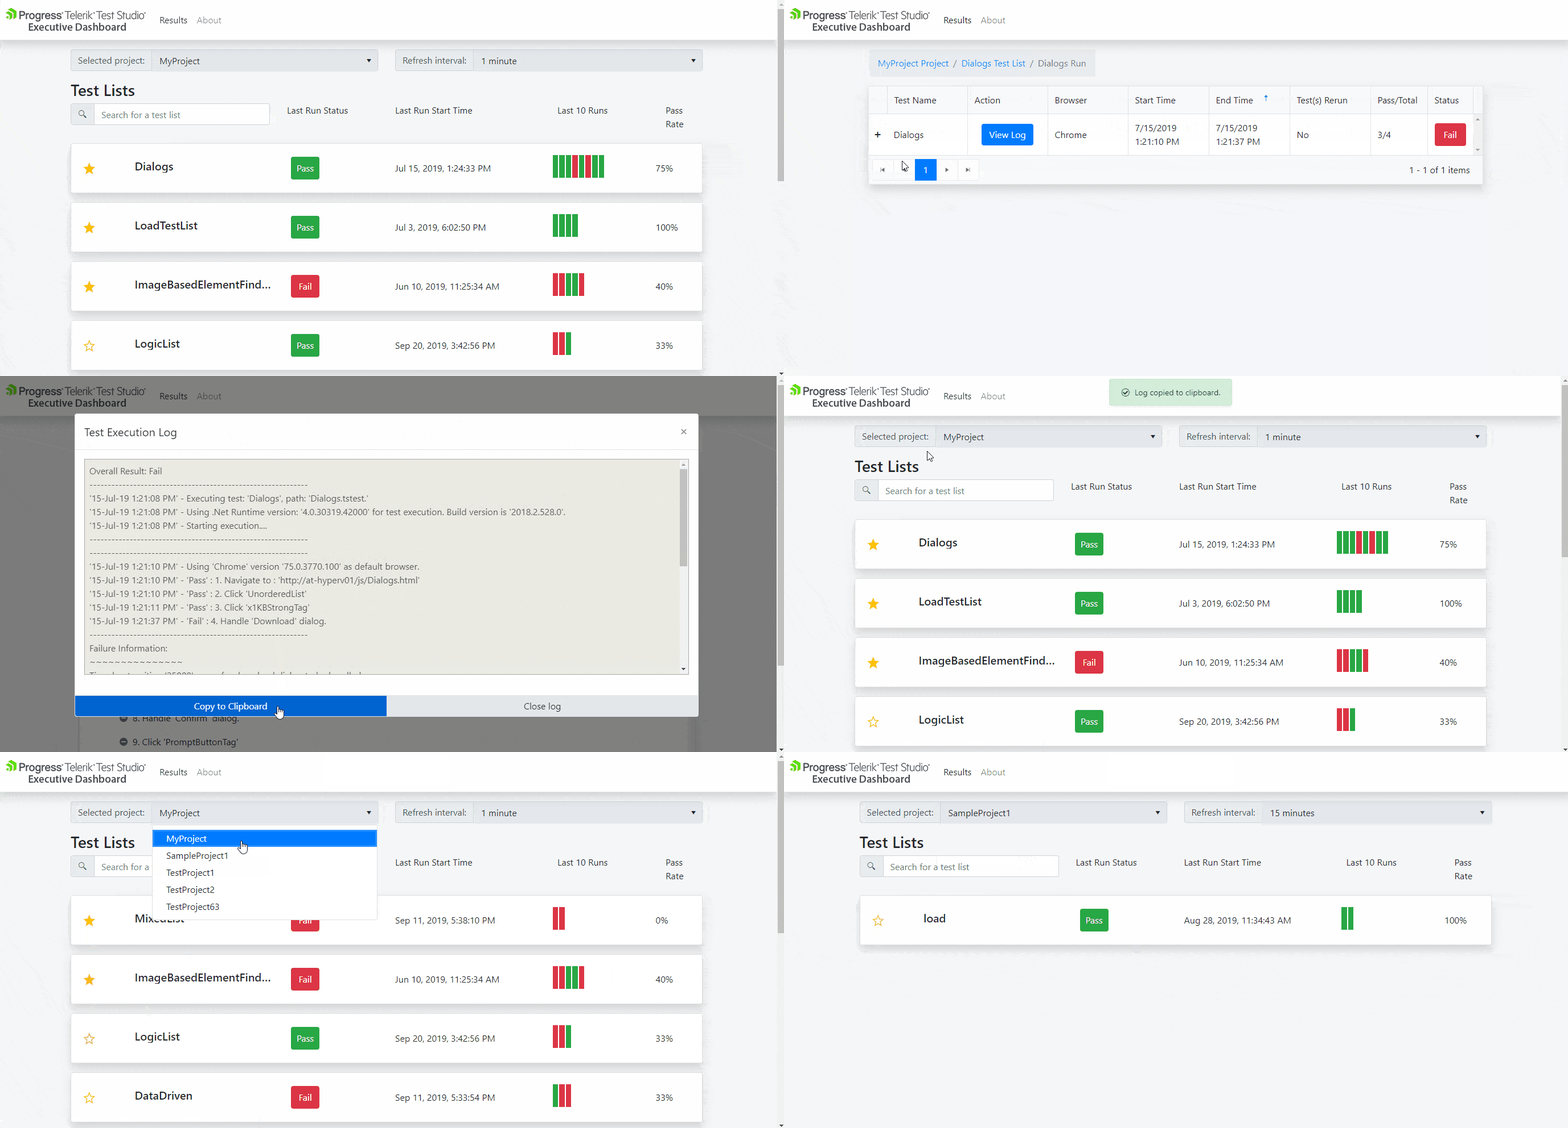
The Executive Dashboard is a brand-new web-based Results Server. It displays all results from any Test Studio project and test list that is configured. Anyone on the team can access it without the need for a Test Studio license. This means that if a stakeholder wants to monitor the product health through the scheduled automated test lists results, he/she can do it anytime in the browser, on the desktop or mobile. Having such visibility and a live results feed can greatly improve the team's efficiency.

The Executive Dashboard is also super helpful for the QA engineer who can drill down into runs, tests and steps, investigating any failures or script issues.

If you run some tests lists locally, don't worry, you can upload them anytime and they will immediately appear in the dashboard.

In terms of features, you can mark favorite test lists which will always appear on top, there is a configurable auto-refresh interval, sortable Test List and Run columns and much more.

Next up is to add Reports into the Executive Dashboard in 2020.

Dashboard

Blazor Applications and Telerik UI for Blazor Support

Blazor is the latest Web UI framework developed by Microsoft and based on C#, HTML, Razor. It runs in the browser via WebAssembly. It will provide an alternative to JavaScript for building rich web apps. This is why Blazor is gaining a lot of traction, promising to be the next big thing in web development.

Progress has always been on top of new technologies and this time we are not falling behind. We have released a rich and powerful set of Blazor components, helping developers build beautiful applications with shorter development cycles, quick iterations and faster time to market.

Test Studio marks the beginning of the Blazor test automation race by joining first and and leading it. If you wonder, “Now how I am going to test these new Blazor apps?” don’t worry, we've got you covered. Test Studio supports any Blazor web application and on top of that has exclusive support for Telerik Blazor components. The party that best understands the internals of a component is the party that built it. Our translators open the element and expose the specific and custom properties for actions automation and verifications. With this, test creation is easier, faster and no additional coding is needed.

The supported Telerik UI for Blazor components are TreeView, TimePicker, Pager, NumericTextBox, List, Grid, DropdownList, DatePicker, DateInput, Button.

Stay tuned for more in 2020!

blazort_870x220

Test Lists in Test Studio Dev Edition (Visual Studio Plugin)

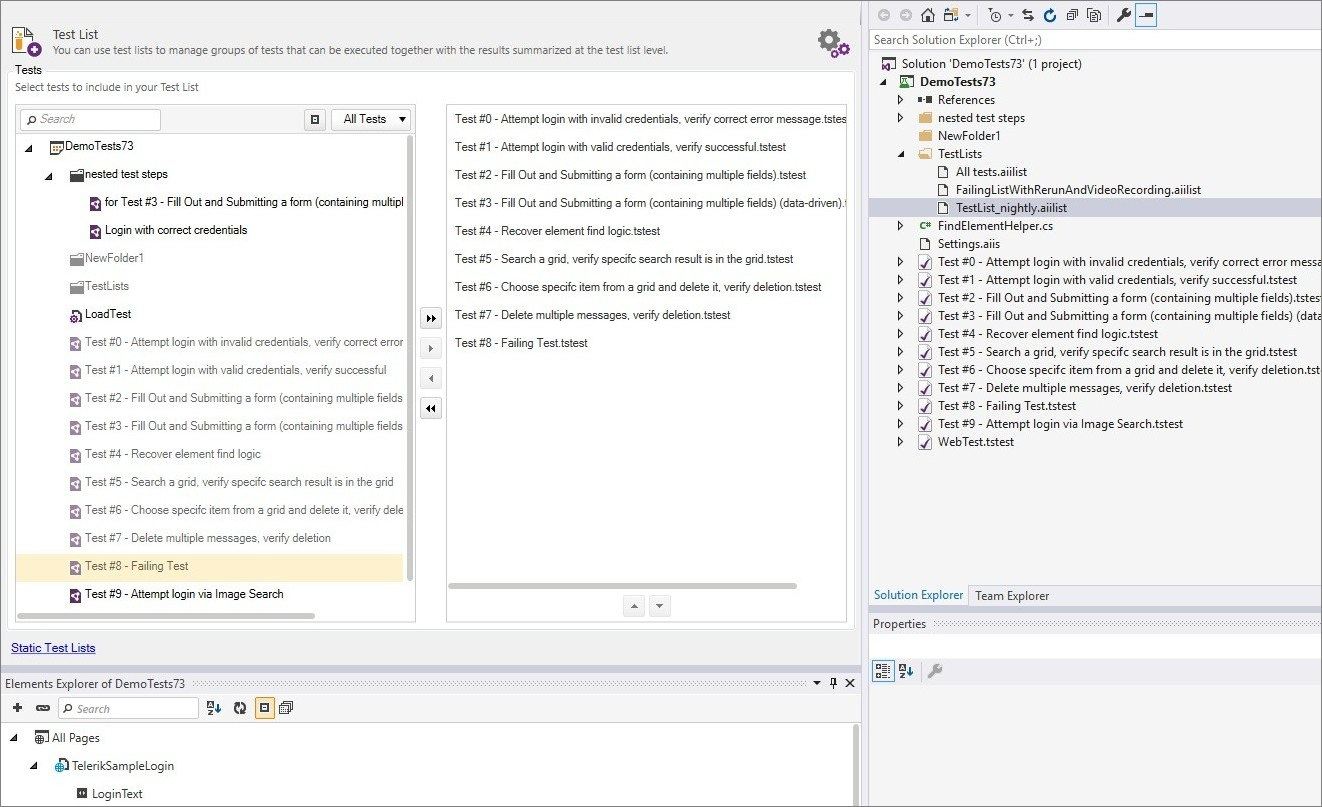
One of the main Test Studio goals is to boost tester-developer collaboration. Along with the standalone product, we provide a Visual Studio plugin also called Test Studio Dev Edition. Dev Edition is perfect for the developer or the Automation QA who wants to make use of Test Studio’s great productivity features in combination with Visual Studio's IDE. According to our developer customers, there was one major functionality that was missing in Test Studio Dev Edition – Test Lists. Now they are a fact inside the product. You can create test lists (collections/suites of tests) in the Visual Studio plugin to run a certain group of tests or include them in your CI/CD pipeline.

VSTestLists_Large

Images as a Primary Element Identification

Test Studio has a unique and bulletproof way of identifying web elements – a combination of DOM-based find logic and images. This is a stable solution to some of the toughest test automation challenges. We are introducing a new option here – the ability to use Images as primary element identification. So, if you know that in a certain scenario the DOM-based logic will not work because of dynamically generated elements or anything else, and you need to fallback to Image, you can choose the image to be the primary identification. Test Studio will first look for the image, so it will save time by not first waiting for the DOM find logic to fail.

All this sounds awesome, right! But wait, there is more. On top of the standard product bug fixes, we improved our code editor inside Test Studio adding search, replace, comment, uncomment options. Load Testing custom dynamic targets now is enhanced with the ability to define shared variables for headers. See the full release notes here.

Happy testing!

Try Test Studio

Check Automation Results Easily with Test Studio’s New Executive Dashboard

$
0
0

Presenting the Test Studio Executive Dashboard - a web feature to monitor automation results. Anybody on the project can use the Dashboard to monitor automation, and thus product health, from any kind of device.

Hey there! I am so excited to share more details with you about one of the newest and coolest Test Studio features from the R3 2019 release. Along with nice features for QAs—such as Blazor Applications support and the ability to create and execute Test Studio test lists in Visual Studio—we’ve decided to please the other stakeholders in a project (like PM and Management) and provide them the ability to check the automation results live via a web page.

Let me introduce you to the Executive Dashboard.

Until now, in order to check Test Studio results you had to have either Test Studio or Results Viewer installed or have them send via email. This made it harder, especially for the non-technical people, to review the results, make a report and so on.

With the Executive Dashboard anyone with the link within the same network can monitor the automation results, drill down test lists and test results and review the exceptions of the failed tests.

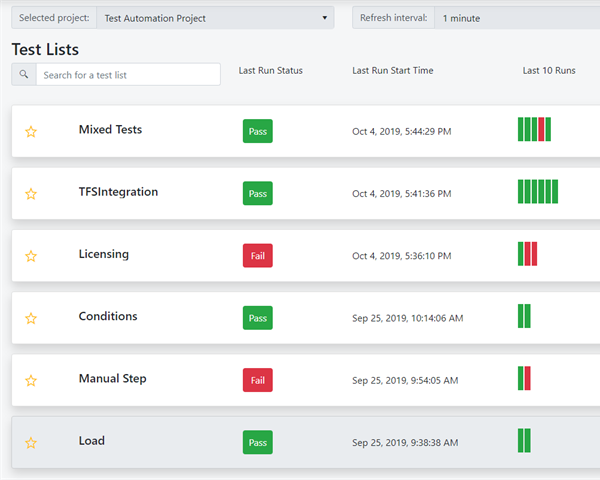
The index page of the Executive Dashboard looks like this:

Executive Dashboard

It works in all browsers and has a responsive design so you can load the page using your mobile phone or tablet.

Prerequisites for the Executive Dashboard

The Executive Dashboard pulls all the data from the scheduling database, and in order to take advantage of this feature you will need the following prerequisites:

  • Storage Service
  • Scheduling Server
  • Executive Dashboard

For the sake of this example we will perform an all-in-one installation, this means that all the features can be installed on different machines, depending on your preferences.

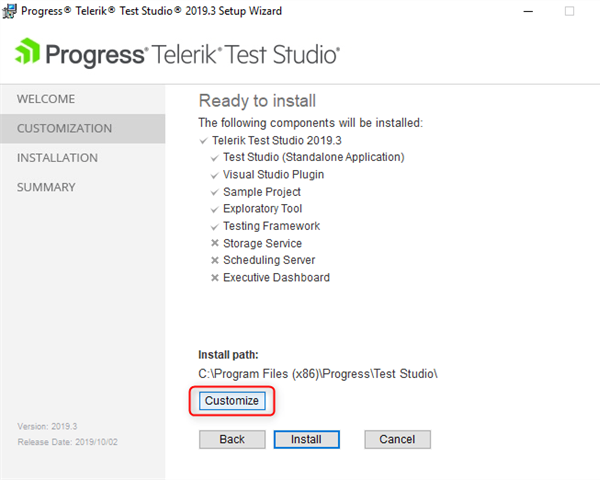
Once you launch the Test Studio installer and accept the license agreement, click on the Customize button to turn on the features mentioned above.

Customize

To perform the installation you can follow the installation procedure as described in this KB article. Once you perform the installation you need to configure the Scheduling environment and execute a test list remotely to have the results appear in the Executive Dashboard.

Refer to this KB article for more information on setting up the scheduling and executing a test list remotely.

You may have a question, “What about local results?” and that’s a reasonable one. Of course we have solution for this. In Test Studio you have the option to upload any local results in the scheduling database and have it displayed in the Executive Dashboard.

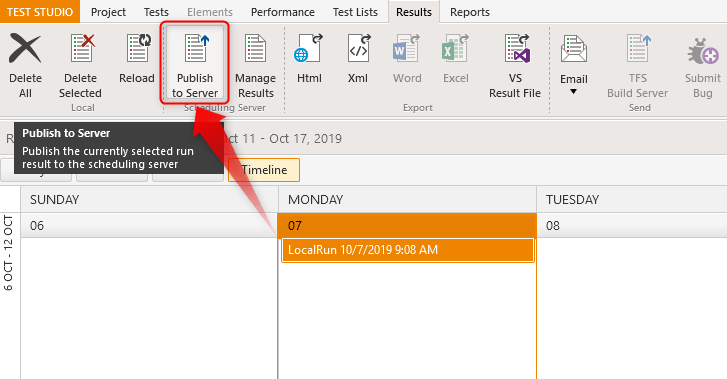
You simply navigate to the result in question, select it and click on Publish to Server button.

Note: You should have the scheduling set up as shown in the KB article above, otherwise thePublish to Server button will be disabled.

Publish to server

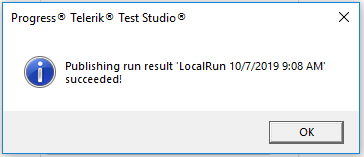
You get confirmation that publishing the run result succeeded:

Publishing succeeded

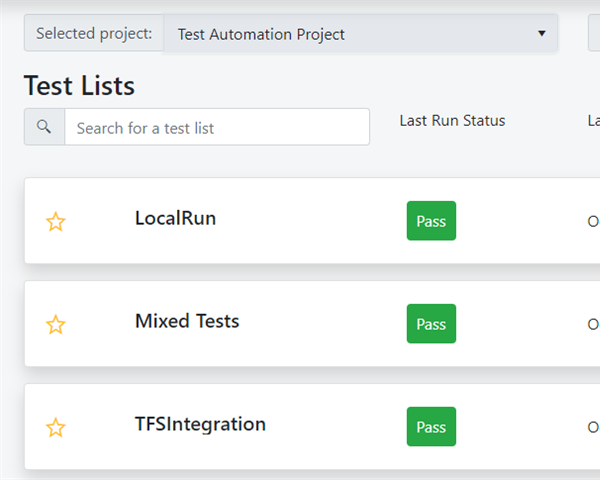
And the result appears on top in the Executive Dashboard.

LocalRun uploaded in Executive Dashboard

3 Useful Features You Should Know about the Executive Dashboard

  1. The Executive Dashboard displays test list runs per project. You can drill down to Test List results and Test Results by selecting the Test List run. If you have multiple projects use Selected Project dropdown to switch between projects:

    Select Project

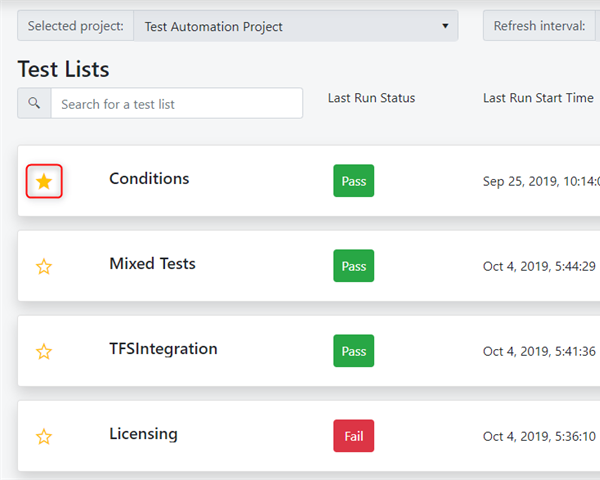
  2. You can add a test list run to favorites by clicking the star icon on the left. The run results are sorted by default by Last Run Start Time, until a favorite is added. Then it is displayed on the top no matter the Last Run Start Time. The rest of the runs use the default sorting.

    add run to favorites

    As you can see from the screenshot above, even though the last run of Conditions is executed on the 25th of September, it is added to favorites so it's placed on top of the runs executed on October 4th. Even if you switch projects the favorite runs are saved per project.

  3. You can use the refresh interval dropdown to select the time on how often the list of the run has to be refreshed. This is added to make things easier for you by eliminating the need to manually refresh. This is extremely helpful if you have dedicated screens/monitors for test results, so this way you can monitor results without taking any additional action.

Along with monitoring the automation results, in the Executive Dashboard you can drill down into each run, test list or single test, to investigate any failures and issues.

You can learn more about the Executive Dashboard over on this this KB article.

QA Professionals and "Framework Fatigue"

$
0
0

How does framework fatigue affect you as a quality professional?

Framework fatigue is frequently associated with software architects, managers, and of course frontend developers. The term has grown in popularity as new JavaScript libraries and frameworks emerge resulting in intra-team factions, endless evaluations and when a framework is finally selected – the uncertainty that a future-proof path has been selected.

How does this uncertainty impact you as a quality professional? Have you been invited to the table for this conversation? Do you know if the tools you use today provide future agility for the uncertainty that lies ahead?

When your colleagues in engineering finally do select a framework, they are likely to leverage components to ensure optimal performance and visual appeal of the UI. Ensuring test-automation compatibility up front for any and all components used can save quality professionals time and frustration.

A good example is the growing adoption of Blazor, which is a free and open source framework developed by Microsoft, allowing developers to create web applications using C# instead of JavaScript. We’ve seen traction not only in the adoption of Blazor itself, but also in the adoption of 3rd party native component suites such as our own Telerik UI for Blazor.

Check in with your counterparts in development – see if they are planning to adopt a new framework, or productivity components. If so, ensure that the automation platform you use will be compatible.

When it comes to compatibility, our popular solution for web automation, Telerik Test Studio, aims for day zero support of browser updates and provides native support for web frameworks and components – from Blazor to React and everywhere in between.

Read about the latest release which includes support for our Blazor components or watch the recent webinar where our team takes you through all the new features.

Testing Dynamic Forms in Angular

$
0
0

Learn how to create a dynamic form in Angular and then create tests for the form to ensure it works as expected.

This article will cover testing of dynamic forms in Angular. Dynamic forms in Angular are forms that are created using reactive form classes like Form Group and Form Controls. We will write tests for these forms to ensure that they function as intended.

For this article, we’ll be testing a sign-up form. The form is generated dynamically by passing an array of objects describing the input elements to the component; then a FormControl will be generated for each element before the form is grouped using FormGroup.

To get started, you have to bootstrap an Angular project using the CLI. To follow this tutorial a basic understanding of Angular is required. Please ensure that you have Node and npm installed before you begin. If you have no prior knowledge of Angular, kindly follow the tutorial here. Come back and finish this tutorial when you’re done.

Initializing Application

To get started, we will use the CLI (command line interface) provided by the Angular team to initialize our project.

First, install the CLI by running npm install -g @angular/cli. npm is a package manager used for installing packages. It will be available on your PC if you have Node installed, if not, download Node here.

To create a new Angular project using the CLI, open a terminal and run:
ng new dynamic-form-tests

Enter into the project folder and start the Angular development server by running ng serve in a terminal in the root folder of your project.

Creating Sign-up Form

To get started, we’ll set up the sign-up form to get ready for testing. The form itself will be rendered by a component separate from the App component. Run the following command in a terminal within the root folder to create the component:

    ng generate component dynamic-form

Open the dynamic-form.component.html file and copy the following content into it:

<!-- src/app/dynamic-form/dynamic-form.component.html --><form[formGroup]="form"(submit)="onSubmit()"><div*ngFor="let element of formConfig"><div[ngSwitch]="element.inputType"><label[for]="element.id">{{ element.name }}</label><span*ngIf="element?.required">*</span><br/><div*ngSwitchCase="'input'"><div*ngIf="element.type === 'radio'; else notRadio"><div*ngFor="let option of element.options"><input[type]="element.type"[name]="element.name"[id]="option.id"[formControlName]="element.name"[value]="option.value"/><label[for]="option.id">{{ option.label }}</label><span*ngIf="element?.required">*</span></div></div><ng-template#notRadio><input[type]="element.type"[id]="element.name"[formControlName]="element.name"/></ng-template></div><select[name]="element.name"[id]="element.id"*ngSwitchCase="'select'"[formControlName]="element.name"><option[value]="option.value"*ngFor="let option of element.options">{{
              option.label
            }}</option></select></div></div><button>Submit</button></form>

We use the ngSwitch binding to check for the input type before rendering. The inputType of the select element is different, so it is rendered differently using the *ngSwitchCase binding. You can add several inputTypes and manage them using the *ngSwitchCase. The file input element, for example, might be rendered differently from the other input elements. In that case, the inputType specified can be file.

For each input element, we add a formControlName directive which takes the name property of the element. The directive is used by the formGroup to keep track of each FormControl value. The form element also takes formGroup directive, and the form object is passed to it.

Let’s update the component to generate form controls for each input field and to group the elements using the FormGroup class. Open the dynamic-form.component.ts file and update the component file to generate form controls for each input and a form group.

// src/app/dynamic-form/dynamic-form.component.tsimport{ Component, OnInit, Input }from'@angular/core';import{ FormControl, FormGroup }from'@angular/forms'
    @Component({
      selector:'app-dynamic-form',
      templateUrl:'./dynamic-form.component.html',
      styleUrls:['./dynamic-form.component.css']})exportclassDynamicFormComponentimplementsOnInit{constructor(){}
      @Input()formConfig =[]
      form: FormGroup;
      userGroup ={};onSubmit(){
        console.log(this.form.value);}ngOnInit(){for(let config ofthis.formConfig){this.userGroup[config.name]=newFormControl(config.value ||'')}this.form =newFormGroup(this.userGroup);}}

The component will take an Input (formConfig) which will be an array of objects containing information about each potential input. In the OnInit lifecycle of the component, we’ll loop through the formConfig array and create a form control for each input using the name and value properties. The data will be stored in an object userGroup, which will be passed to the FormGroup class to generate a FormGroup object (form).

Finally, we’ll update the app.component.html file to render the dynamic-form component and also update the app.component.ts file to create the formConfig array:

<-- src/app/app.component.html -->
    
    <section><app-dynamic-form[formConfig]="userFormData"></app-dynamic-form></section>

Next is the component file. Open the app.component.ts file and update it with the snippet below:

import{ Component, OnInit }from'@angular/core';
    @Component({
      selector:'my-app',
      templateUrl:'./app.component.html',
      styleUrls:['./app.component.css']})exportclassAppComponent{
      userFormData =[{
          name:'name',
          value:'',type:'text',
          id:'name',
          inputType:'input',
          required:true},{
          name:'address',
          value:'',type:'text',
          id:'address',
          inputType:'input',},{
          name:'age',
          value:'',type:'number',
          id:'age',
          inputType:'input',},{
          name:'telephone',
          value:'',type:'tel',
          id:'telephone',
          inputType:'input',},{
          name:'sex',type:'radio',
          inputType:'input',
          options:[{
              id:'male',
              label:'male',
              value:'male'},{
              id:'female',
              label:'female',
              value:'female'}]},{
          name:'country',
          value:'',type:'',
          id:'name',
          inputType:'select',
          options:[{
              label:'Nigeria',
              value:'nigeria'},{
              label:'United States',
              value:'us'},{
              label:'UK',
              value:'uk'}]},]}

The userForm array contains objects with properties like type , value, name. These values will be used to generate appropriate fields on the view. This lets us add more input fields in the template without manually updating the template. This array is passed to the dynamic-form component.

Don’t forget that to use Reactive Forms, you have to import the ReactiveFormsModule. Open the app.module.ts file and update it to include the ReactiveFormsModule:

// other imports ...import{ FormsModule, ReactiveFormsModule }from'@angular/forms';
    
    @NgModule({
      imports:[// ...other imports 
        ReactiveFormsModule 
      ],//...})exportclassAppModule{}

Testing the Form

When generating components, Angular generates a spec file alongside the component for testing. Since we’ll be testing the dynamic-form component, we’ll be working with the dynamic-form.component.spec.ts file.

The first step is to set up the test bed for the component. Angular already provides a boilerplate for testing the component, and we’ll simply extend that. Open the dynamic-form.component.spec.ts and update the test bed to import the ReactiveFormsModule that the component depends on:

import{async, ComponentFixture, TestBed }from'@angular/core/testing';import{ ReactiveFormsModule }from'@angular/forms';import{ DynamicFormComponent }from'./dynamic-form.component';describe('DynamicFormComponent',()=>{let component: DynamicFormComponent;let fixture: ComponentFixture<DynamicFormComponent>;beforeEach(async(()=>{
        TestBed.configureTestingModule({
          declarations:[ DynamicFormComponent ],
          imports:[ ReactiveFormsModule ],}).compileComponents();}));beforeEach(()=>{
        fixture = TestBed.createComponent(DynamicFormComponent);
        component = fixture.componentInstance;
        fixture.detectChanges();});it('should create',()=>{expect(component).toBeTruthy();});});

We’ll be testing our form using the following cases:

  • Form rendering: here, we’ll check if the component generates the correct input elements when provided a formConfig array.
  • Form validity: we’ll check that the form returns the correct validity state
  • Input validity: we’ll check if the component responds to input in the view template
  • Input errors: we’ll test for errors on the required input elements.

To begin testing, run the following command in your terminal: yarn test or npm test

Form Rendering

For this test, we’ll pass an array of objects containing data about the input elements we wish to create, and we’ll test that the component renders the correct elements. Update the component’s spec file to include the test:

describe('DynamicFormComponent',()=>{// ... test bed setupbeforeEach(()=>{
        fixture = TestBed.createComponent(DynamicFormComponent);
        component = fixture.componentInstance;
        component.formConfig =[{
            name:'name',
            value:'',type:'text',
            id:'name',
            inputType:'input',
            required:true},{
            name:'address',
            value:'',type:'text',
            id:'address',
            inputType:'input',},]
        component.ngOnInit();
        fixture.detectChanges();});it('should render input elements',()=>{const compiled = fixture.debugElement.nativeElement;const addressInput = compiled.querySelector('input[id="address"]');const nameInput = compiled.querySelector('input[id="name"]');expect(addressInput).toBeTruthy();expect(nameInput).toBeTruthy();});});

We updated the test suite with the following changes:

  1. We assigned an array to the formConfig property of the component. This array will be processed in the OnInit lifecycle to generate form controls for the input elements and then a form group.
  2. Then we triggered the ngOnInit lifecycle. This is done manually because Angular doesn’t do this in tests.
  3. As we’ve made changes to the component, we have to manually force the component to detect changes. Thus, the detectChanges method is triggered. This method ensures the template is updated in response to the changes made in the component file.
  4. We get the compiled view template from the fixture object. From there, we’ll check for the input elements that should have been created by the component. We expected two components — an address input and a name input.
  5. We’ll check if the elements exist using the toBeTruthy method.

Form Validity

For this test, we’ll check for the validity state of the form after updating the values of the input elements. For this test, we’ll update the values of the form property directly without accessing the view. Open the spec file and update the test suite to include the test below:

it('should test form validity',()=>{const form = component.form;expect(form.valid).toBeFalsy();const nameInput = form.controls.name;
        nameInput.setValue('John Peter');expect(form.valid).toBeTruthy();})

For this test, we’re checking if the form responds to the changes in the control elements. When creating the elements, we specified that the name element is required. This means the initial validity state of the form should be INVALID, and the valid property of the form should be false.

Next, we update the value of the name input using the setValue method of the form control, and then we check the validity state of the form. After providing the required input of the form, we expect the form should be valid.

Input Validity

Next we’ll check the validity of the input elements. The name input is required, and we should test that the input acts accordingly. Open the spec file and add the spec below to the test suite:

it('should test input validity',()=>{const nameInput = component.form.controls.name;const addressInput = component.form.controls.address;expect(nameInput.valid).toBeFalsy();expect(addressInput.valid).toBeTruthy();
    
        nameInput.setValue('John Peter');expect(nameInput.valid).toBeTruthy();})

In this spec, we are checking the validity state of each control and also checking for updates after a value is provided.

Since the name input is required, we expect its initial state to be invalid. The address isn’t required so it should be always be valid. Next, we update the value of the name input, and then we test if the valid property has been updated.

Input Errors

In this spec, we’ll be testing that the form controls contain the appropriate errors; the name control has been set as a required input. We used the Validators class to validate the input. The form control has an errors property which contains details about the errors on the input using key-value pairs.

s_B627623ACECF3DCB4B58A57BA31AF692B356F096E54A587B9792CBF5F5D10C9C_1551623628778_Screenshot+2019-03-03+at+3.33.33+PM

The screenshot above shows an example of how a form control containing errors looks. For this spec, we’ll test that the required name input contains the appropriate errors. Open the dynamic-form.component.spec.ts file and add the spec below to the test suite:

it('should test input errors',()=>{const nameInput = component.form.controls.name;expect(nameInput.errors.required).toBeTruthy();
    
        nameInput.setValue('John Peter');expect(nameInput.errors).toBeNull();});

First, we get the name form control from the form form group property. We expect the initial errors object to contain a required property, as the input’s value is empty. Next, we update the value of the input, which means the input shouldn’t contain any errors, which means the errors property should be null.

If all tests are passing, it means we’ve successfully created a dynamic form. You can push more objects to the formConfig array and add a spec to test that a new input element is created in the view.

Conclusion

Tests are vital when programming because they help detect issues within your codebase that otherwise would have been missed. Writing proper tests reduces the overhead of manually testing functionality in the view or otherwise. In this article, we’ve seen how to create a dynamic form and then we created tests for the form to ensure it works as expected.


One More Thing: End-to-End UI Test Automation Coverage

On top of all unit, API, and other functional tests that you create, it is always a good idea to add stable end-to-end UI test automation to verify the most critical app scenarios from the user perspective. This will help you prevent critical bugs from slipping into production and will guarantee superb customer satisfaction.

Even if a control is fully tested and works well on its own, it is essential to verify if the end product - the combination of all controls and moving parts - is working as expected. This is where the UI functional automation comes in handy. A great option for tooling is Telerik Test Studio. This is a web test automation solution that enables QA professionals and developers to craft reliable, reusable, and maintainable tests.


Telerik JustMock Gains Improvements for Azure DevOps and More with R1 2020

$
0
0

I am excited to present to you the R1 2020 release of our mocking framework JustMock which includes improvements to the Azure Pipeline task, new integration with Visual Studio code coverage for .NET Core and implementation of ArrangeSet and AssertSet methods to the MockingContainer.

Without further ado let me introduce you the new features and most important fixes.

JustMock Azure Pipeline Task Supports .NET Core Tests

We know your pains and we are addressing them. The execution of JustMock unit tests targeting .NET Core in Azure pipeline had a different approach than those targeting the .NET Framework. With this release, we are unifying how the tests for both platforms are executed and now you can use only the JustMock task to execute your tests without other additional tasks, tooling or settings. The new version of the extension is already uploaded and the task will be automatically updated in your pipeline. If you would like to try it here is the link to the marketplace..

JustMock Azure Pipeline Task Supports .NET Core

JustMock Azure Pipeline Task Supports VS 2019 as a Test Platform version

Another pain you wrote us frequently about is the lack of support for Visual Studio 2019 test platform. With this release we are providing this option for you. In addition to that we have fixed an issue with failing tests when the “Installed by Tools Installer” option is selected for test platform version. With this we have implemented and fixed all known issues and requests related to the test platform version.

Implement VS 2019 as a Test platform option for the Azure Pipeline task

Integration with VS Code Coverage for .NET Core

Many of our clients are using Visual Studio Enterprise and they love the build in code coverage. Actually, this is the tool that JustMock is most frequently integrated with. However, there was a limitation. The integration could be used only for projects targeting .NET Framework. With this new release we are introducing support for projects targeting .NET Core as well.

JustMock is Now Integrated with VS Code Coverage for .NET Core-770

ArrangeSet and AssertSet Methods for MockingContainer

Until now it was difficult and additional efforts were required to arrange and assert the set operation of a property when you used our implementation of an IoC container named MockingContainer. This is why we implemented the ArrangeSet and AssertSet method for the MockingContainer. The API is now similar to the one for mocking normal property set operation.

[TestMethod]
publicvoidShouldAssertAllContainerArrangments()
{
    // Arrange
    var container = newMockingContainer<ClassUnderTest>();
  
    container.Arrange<ISecondDependency>(
       secondDep => secondDep.GetString()).MustBeCalled();
    container.ArrangeSet<IThirdDependency>(
        thirdDep => thirdDep.IntValue = Arg.AnyInt).MustBeCalled();
  
    // Act
    var actualString = container.Instance.StringMethod();
    container.Instance.SetIntMethod(10);
  
    // Assert
    container.AssertSet<IThirdDependency>(thirdDep => thirdDep.IntValue = 10);
    container.AssertAll();
}

Visual Studio Debugger Arrowhead Pointer is Messed when Profiler is Enabled with .NET Core

This issue was very unpleasant. While debugging the code you have mocked in a .NET Core project the debugger arrowhead pointer was at a different line of the code than the actual one. After thorough research of what is causing the issue, we found out that the underlining problem is a bug in the .NET Core CLR. Long story short, Microsoft provided a fix to this bug. If you would like to take advantage of this fix you could upgrade your application to .NET Core 3.1 version, which includes the fix.

Try It Out and Share Your Feedback

The R1 2020 release is already available for download in customers’ accounts. If you are new to Telerik JustMock, you can learn more about it via the product page. It comes with a 30-day free trial, giving you some time to explore the capabilities of JustMock.

Try Now

Be sure to sign up for the Telerik R1 2020 release webinar on Tuesday, January 21st at 11:00 AM ET  for a deeper look at all the goodness in the release, where our developer experts will go over everything in detail.

Reserve Your Webinar Seat

Feel free to drop us a comment below sharing your thoughts. Or visit our Feedback Portal and let us know if you have any suggestions or if you need any particular features.

You can also check our Release History page for a complete list of the included improvements.

What’s New in the Latest Test Studio Service Pack

$
0
0

Test Studio is one of the first tools to support the new Microsoft Edge Chromium-based browser.

To provide tooling for building efficient, fast tests with full browser coverage has always been one of our main goals. Out-of-the-box cross-browser support is something that our customers value a lot. This is why we added support for the official release of the new Edge Chromium. In the latest Test Studio service pack (R3 2019 SP2) you can record and playback tests on the new Edge, IE, Chrome and Firefox.

Edge support is not the only great addition to the product. Here is the list with other features and improvements:
  • The ability to preserve the state of opened tests on Test Studio restart – if you enable that option, when you restart Test Studio, all previously opened tests will be reopened.
  • Project settings import - when you have everything lined up and working in your existing Test Studio project, but you need to start a new one, you would like to transfer some of the settings for quicker project setup. Now you can select which settings to be imported to new projects.
  • Translator optimization:
    • In Project Settings translators now can be selected or deselected by group.
    • Translator loading is optimized for faster recording experience.
  • Export Load test results summary to HTML.
  • New ScrollToVisible to window center option is introduced for action steps.

On top of this there are a ton of UI improvements and bug fixes that will make your life as a tester better. You can check out the full list.

You can download the latest version right now from your account. Or if you're new to Test Studio, get started with a free trial today.

Start Your Trial

Happy Testing!

Test Studio to Focus on Web Testing

$
0
0

The change is intended to provide maximum value for your highest priority projects.

Based on customer feedback and product usage, we plan to focus our Test Studio engineering resources on web testing, including support for web-related load, responsive and web services testing. This shift will help ensure that we can provide maximum value to customers for their highest priority projects. That means we will be discontinuing the Test Studio mobile native/hybrid application testing (“Mobile Testing Feature”).

The massive shift towards agile practices requires substantial investments into CI/CD methods for frequent application delivery. The ability to execute quick and stable test automation is an inseparable part of this process. In order to enhance our customer’s test execution and flexibility, we’re adding one free Test Studio Run-Time license per each Test Studio Ultimate license seat, for all existing and new customers.

What Does This Mean Going Forward?

Discontinuance of Mobile Testing Feature

We are providing you with notice that the change related to the Mobile Testing Feature will be implemented starting with the R1 release of Test Studio on March 31, 2020 and as of this date support will be provided for the Mobile Testing Feature until March 31, 2021 in accordance with the applicable terms of the Progress End User License Agreement available at: https://www.telerik.com/purchase/license-agreement/teststudio.

After March 31st, 2021 the Mobile Testing Feature will no longer be part of the Test Studio Product.

However, if you are currently using the Mobile Testing Feature and choose not to update to a newer release you may continue to use the Test Studio Product previously licensed to you for the duration of your existing license.

R1 2020 Release

The Test Studio Mobile Testing Feature in R1 2020 can be initiated using the executable in the installation directory:

\<Your Path>\Progress\Test Studio\Bin\MobileStudio\Telerik.MobileTesting.exe

The documentation related to the Mobile Testing Feature will remain available online until March 31st, 2021.

Future Plans and Research for Responsive Testing

The Test Studio team is working on a new Responsive testing feature that will allow you to check the appearance and functionality of your web applications in any device resolution. We would like to provide the best and most complete Web test automation tool. This is why we chose to develop the Responsive testing feature along with the other major UI/UX product improvements and features.

Future plans described in this communication are intended for informational purposes only and should not be relied upon when making any purchasing decision. We may decide to add new features at any time depending on our capability to deliver products meeting our quality standards. The development, releases and timing of any features or functionality described for Telerik products remains at the sole discretion of Progress. Nothing in this communication represents a commitment, obligation or promise by Progress to deliver or otherwise make available any products or product features at any time in the future.

Run-Time Licenses for Test Studio Ultimate Customers

All new and existing Test Studio Ultimate licensees will receive one free Test Studio Run-Time license with each user license. (An existing Test Studio Ultimate licensee is a licensee who holds a perpetual Test Studio Ultimate license and/or a “term” or “subscription” based Test Studio Ultimate licensee who is currently in an active license period for which all relevant accrued license fees have been paid).

The free license for perpetual license holders will be an add-on to existing license and supported under and for the remainder of you existing maintenance and support subscription. Free license for term/subscription license holders will last for the remainder of your existing subscription/term license.

We’re Here to Help

We’re ready and able to assist you at any time. Please reach out to your account manager or contact me directly at Iliyan.panchev@progress.com. Thank you for your continuing support.

New Reports and Web Components Support in Test Studio R1 2020

$
0
0

Test Studio R1 2020 is out! With it Shadow DOM is no longer a problem at all. Sharing beautiful reports of your application and test automation quality has never been easier.

Let me picture for you a situation that you may already have been stuck into. While you automate your web tests, you clearly see some elements on the screen but you cannot find in the DOM tree of your application and you have no idea how to access them through your test scripts. You can use a recorder to record some steps against these elements but during execution, the test fails to locate them or performs the desired action on another element.

Sound familiar? Well, most probably the app under test uses “Web Components,” a technology that is gaining a lot of traction recently but is making the quality assurance engineer's life a lot harder.

Web Components Support

ShadowDOM

“Web Components” is a modern browser feature based on three main technologies:

  • Shadow DOM - allows the creation of a whole new encapsulated DOM attached to an element
  • HTML templates - allows the reuse of markup templates by <template> and <slot> tags which are not displayed and rendered by the browser
  • Custom elements - allows the creation of custom elements and is tightly integrated with the previous two technologies

Web Components are very powerful but extremely hard to automate. Test automation with a Shadow DOM is a challenge because the elements inside a Shadow DOM subtree don’t exist in the main DOM tree.

Fortunately, Test Studio provides out-of-the-box support, which ensures seamless and stable test automation with or without Web Components (Shadow DOM, templates or Custom elements) in your application. Test Studio identifies all Shadow DOM trees in the loaded page and records/executes any action, verification, real click or type against that element as if it is a regular element part of the main DOM tree.

Undoubtedly “Web Components” support is amazing news for all testers who automate, but we also have a pleasant surprise for managers. They usually need to use a lot of reports, and they want them beautiful, easy to create and green. Well, while the last part is up to the development team, Test Studio takes care of the first two.

Reports in the Executive Dashboard

Test Studio Reports

Test Studio Executive Dashboard is a web page that allows you to monitor test results reported from all testing agents. With this release, beautiful reports can be also generated inside the Executive Dashboard. Select a time period and one or multiple test lists, and the Executive Dashboard does the rest. All reports can be easily shared by just sending the link. Anyone can access it in their browser, no matter if they have active Test Studio license or not.

Along with these great new additions to Test Studio’s feature set, we also shipped a lot of improvements and bug fixes. You can take a look at the full changelog here.

You can download the latest Test Studio version from your account right now. Or if you're new to Test Studio, get started with a free 30-day full-featured trial today.

Start Your Trial

Happy testing!

Meet Our Mascots: The New Telerik Ninja and Kendo UI Kendoka!

$
0
0

We’re excited to announce the new Telerik and Kendo UI mascots! Your familiar Ninja and Kendoka have evolved but remain your faithful companions. You’ll also notice updated branding across our website and beyond, plus a refreshed UX to help you get around with ease. 

For nearly two decades, several generations of Telerik Ninjas have served faithfully as mascots for our productivity tools for .NET developers. Ten years ago, the first Kendo UI Kendoka appeared. The martial arts training was no coincidence as it promotes three of our main values as a company: doing things a little better every day, contributing to our community and adapting quickly to a dynamic environment. Indeed, Telerik and Kendo UI enable .NET and JavaScript developers to cut down development time and increase productivity while delivering engaging web, desktop and mobile experiences every day.

The Telerik Ninja and Kendo UI Kendoka

The Telerik Ninja and Kendo UI Kendoka

Our mission is to provide the needed components and tools for all .NET technologies and the major JavaScript frameworks and enable developers to implement the latest design and UX trends, so your apps can always be sleek and user-friendly. At the same time, we are always looking ahead to the technologies on the horizon, so we can deliver the needed innovation even before our customers need it – be it in design and UX, new technology frameworks or new application development paradigms such as AR/VR.  

We feel that our mascots should express that and speak for the same values – capable, modern, innovative, trustworthy. Meet the new generation of the Ninja and the Kendoka. The new graphic design evolves the fundamentals of our brand while remaining faithful to our true nature.  

Telerik Ninja

Kendo UI Kendoka

With their newly-gained flexibility, they can now tell the Progress Telerik and Kendo UI story in fresh and colorful new ways. Our heroes come with a new, vibrant color palette that will help you easily distinguish our brands and, we hope, make it an even more pleasant experience to come back to our websites.

New Telerik Colors & Icons

We also felt our website should be more welcoming while offering the same outstanding level of experience that our products do. To achieve that, we’ll be updating the website experience in the coming days and weeks, and we’re excited to offer you a quick sneak-peek into it with our new homepage: www.telerik.com  

New Telerik Website

The new experience will get you to the right solution faster, make it easier to explore products and offer quick access to all your assets—product documentation, demos, learning experiences, support and your account. 

If you love the new visuals as much as we do, check out this wallpaper we’ve prepared for you.   Download the wallpaper

New Telerik Wallpaper

Join the Raffle

If you like the new Ninja and Kendoka, please help us spread the news by sharing on your Twitter, Facebook or LinkedIn profile and tagging us with @Telerik/@KendoUI. You can use the widget below to spread the news & enter our raffle for a chance to win one of the following prizes:

Telerik Raffle Prizes

Time to Enter the Raffle!

Use the widget below to complete both Step 1 & Step 2 for a chance to win one of the awesome prizes! 

a Rafflecopter giveaway Good luck!
Viewing all 339 articles
Browse latest View live